Module I5
Interface II: arterioles to capillaries
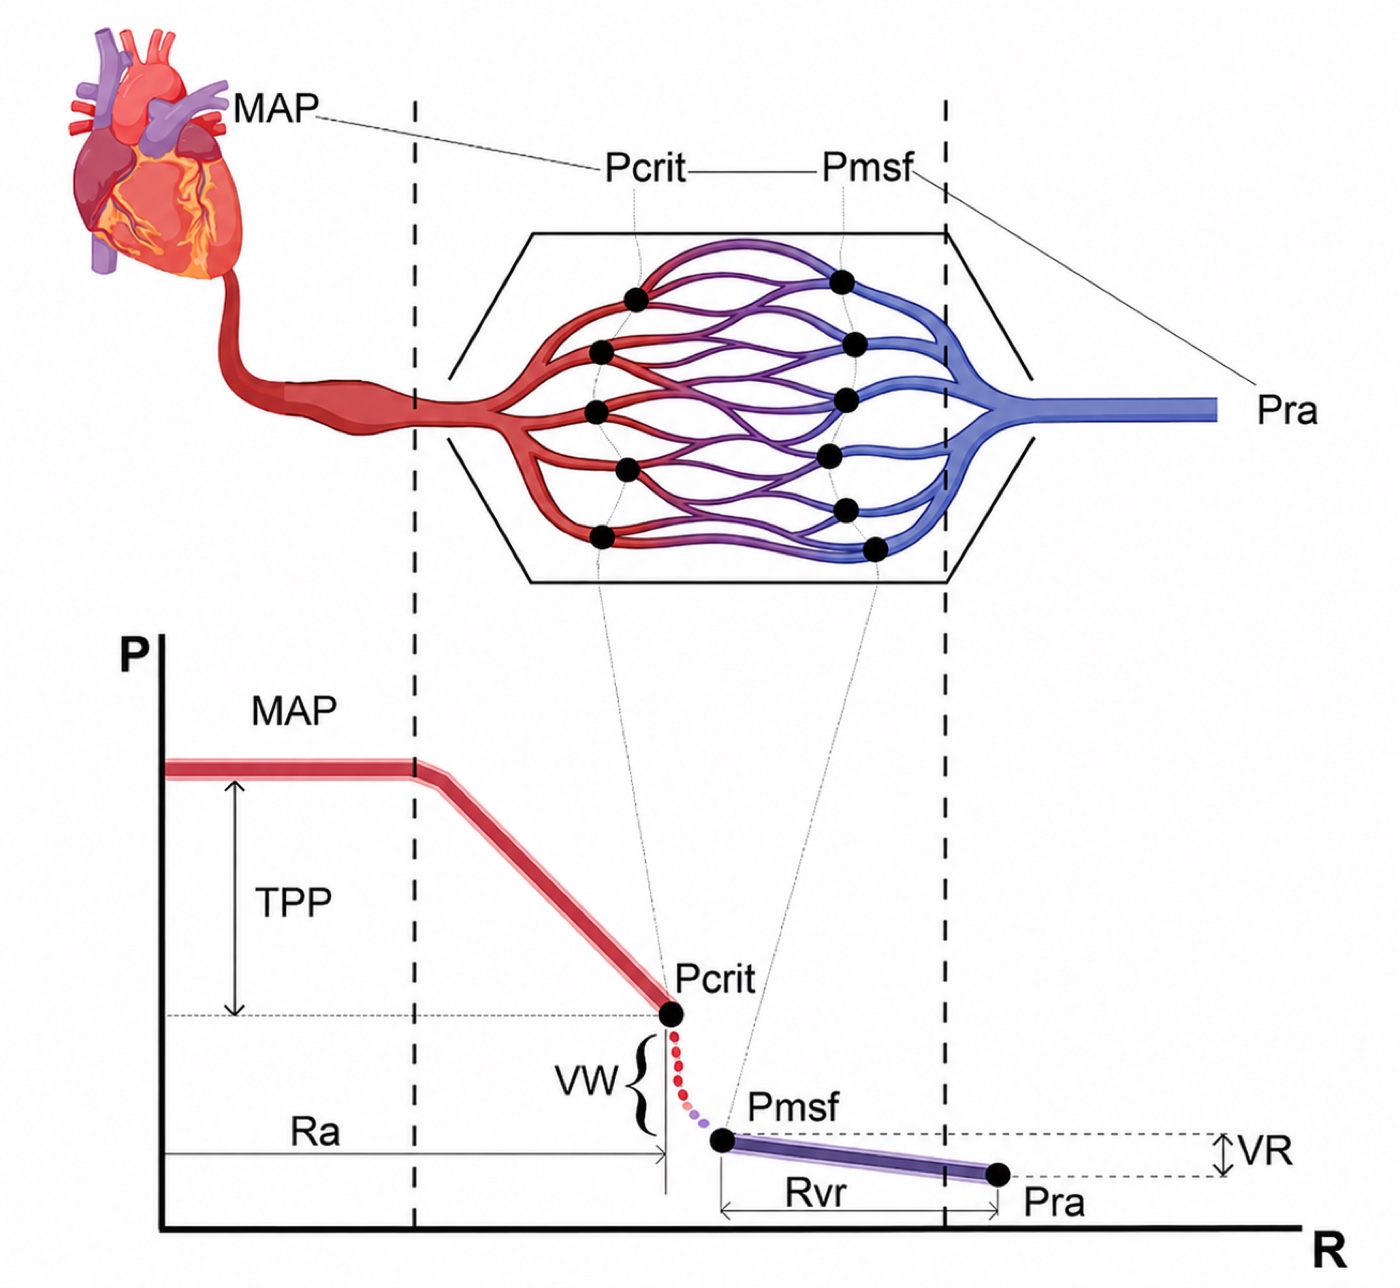
Module I4 followed the ejected stroke volume out into the arterial tree and ended at a term it deliberately left undefined. The first interface is written as MAP − Pcrit = SVR × CO, and every quantity in it is familiar except the one that closes the equation. Pcrit, the critical closing pressure of the arterioles, is the downstream pressure of the systemic arterial circulation. It is not measured on any monitor, it is not the right atrial pressure, and it is not zero. Module N4 named it in a sentence and deferred it, which was the right decision there. Until it has a mechanism it is a symbol placed at the end of an equation to make the arithmetic come out, which is exactly how most clinicians carry it.
This module gives it that mechanism, and then follows the consequences, because they are larger than the term looks. If the downstream pressure of the arterial circulation is a variable that vasoactive drugs move independently of mean arterial pressure, then the gradient actually driving blood into tissue is not the gradient anybody reads off a screen. If the arteriole regulates its own caliber in response to local pressure and local metabolism, then the flow arriving at a given organ is not a fixed function of the arterial pressure at all, and the range over which that is true differs between organs, between patients, and between the same patient on two consecutive days. Those two facts together are why fixed mean arterial pressure targets have performed the way they have in randomized trials, and why the physiologic reading of those trials is more useful than their headline results.
The boundary of this module is the arteriolar outlet. The capillary network beyond it, with its density, its flow heterogeneity and its glycocalyx, is Module I6. The venous side of the capillary and the Starling forces are Module I7. The perfusion markers are already written up as tools in Module I11 and are used here as evidence rather than taught again. What is owned here is the arteriole: why the regulation sits there, what a critical closing pressure is and where it comes from, and what "not all MAPs are equal" means once it stops being a slogan.
Within this module, Pcrit is the pressure threshold below which an arteriole can no longer remain open. In the four-interface model it also marks the effective downstream boundary of the arterial side of the circulation. For now, the important idea is simple: as long as local arterial pressure stays comfortably above Pcrit, the vessel remains patent. As pressure approaches Pcrit, flow becomes increasingly vulnerable to limitation and closure. Later in the module we will return to an important nuance: Pcrit can be used mathematically as a boundary in pressure-flow models, but physically it is best understood as a closing threshold rather than as a pressure that continuously opposes flow under every condition.
The arteriole as the site of regulation
Module I1 made the general point that resistance varies with the inverse fourth power of vessel radius and that the systemic pressure drop is therefore concentrated on the arterial side. That is where most treatments stop. The question worth asking is more specific: why is the drop concentrated in vessels of one particular size, the small arteries and the arterioles, rather than distributed along the tree or concentrated somewhere more obvious like the aorta?
Why the resistance sits here and nowhere else
Two quantities change in opposite directions as blood moves distally, and where they cross determines where the pressure falls. Individual vessel radius falls steadily, which raises the resistance of each vessel steeply. Total cross-sectional area of the tree rises steadily as vessels branch, and because the vessels at each generation are in parallel, more of them in parallel lowers the resistance of the generation as a whole. The aorta is a single wide tube, so its individual resistance is negligible. The capillary bed contains billions of vessels whose combined cross-sectional area is enormous, so despite each capillary being narrow the bed as a whole offers less resistance than intuition suggests. The arterioles sit at the crossing point, narrow enough that the fourth power has begun to dominate but not yet numerous enough for parallel arrangement to rescue them.
That is the anatomic half of the answer. The functional half is that the arteriole is built to change. Its wall carries a high ratio of smooth muscle to lumen, it is densely innervated by sympathetic fibres, and it is bathed in the metabolic products of the tissue it supplies. No other segment of the circulation combines a large resting resistance with the machinery to vary that resistance rapidly. The consequence is a clean division of labour across the whole circulation, and it is worth naming because the rest of this pathway depends on it: the large arteries conduct and buffer, the arterioles regulate and dissipate, the capillaries exchange, and the veins store. Interface II is the boundary between the second of those jobs and the third. The model this curriculum uses throughout, in which the vasculature rather than the heart sets most of the terms, comes from Sylvester, Goldberg and Permutt's account of the role of the vasculature in the regulation of cardiac output, and the arteriolar segment is where that role is exercised.
One clinical fact falls directly out of the anatomy. Because almost the entire arterial pressure drop occurs across the arterioles, the mean arterial pressure is nearly the same in the aorta and in the radial artery, which is what licenses reading a radial mean as a central one even though the systolic pressure at the two sites differs substantially. That constancy is not a coincidence, it is the concentration of resistance in the arterioles seen from the other end.
What the fourth power actually buys the arteriole
The inverse fourth power relationship is quoted constantly and its magnitude is rarely worked. Doing so once makes the rest of the module concrete.
A smooth muscle cell that shortens enough to take 20 percent off the radius of an arteriole has more than doubled that vessel's resistance. This is a very small mechanical excursion for a very large hemodynamic effect, and it is what allows a circulation to redirect flow between organs within seconds without the heart changing anything. It also sets the sensitivity of the system to drugs. A vasopressor does not need to produce a dramatic anatomic change to double systemic resistance, which is the same statement as saying that the dose response is steep and that a small overshoot in tone is not a small physiologic event.
Series and parallel, and why one number cannot describe the bed
The systemic arterioles are not one resistor. They are millions of resistors in parallel, grouped into vascular beds that are themselves in parallel, each with its own regulation and its own local demand. Two consequences follow.
First, total systemic resistance is a parallel sum, so it is dominated by the beds that are open. Constricting one bed hard while another dilates can leave the calculated resistance unchanged while the distribution of flow has been transformed. A patient can have an unremarkable systemic vascular resistance and a gut, a kidney or a muscle bed that is not being perfused, which is how global hemodynamics normalize while a single organ fails.
Second, the arterioles of a bed are also arranged in series, from the small artery down through several generations to the terminal arteriole, and tone is not distributed evenly along that series. Sylvester, Gilbert, Traystman and Permutt demonstrated this in anesthetized dogs on cardiac bypass by measuring closing pressure directly, as the lowest pressure to which arterial pressure fell after inflow was suddenly stopped. During hypoxic hypoxia the closing pressure rose while the arterial resistance fell. During carbon monoxide hypoxia both fell together. The authors' conclusion is the useful part: the two forms of hypoxia produced a qualitative difference in vasomotor behaviour that would have been missed entirely if only resistance had been measured, and the reason is that resistance and closing pressure are determined largely by different portions of the arterial bed whose tone can change independently.
Hold onto that result, because it is the experimental basis for a claim this curriculum makes repeatedly and rarely proves. Calculated resistance is not a measurement of arteriolar tone. Tone changed markedly in that preparation and resistance moved in the wrong direction. I4 derives the calculated systemic vascular resistance and lists what it is computed from. This is why the number behaves the way it does.
Critical closing pressure, derived
The term is used across this curriculum as though it were self-explanatory, and it is not. Deriving it properly takes three steps: why a vessel with tone closes at a pressure well above the pressure around it, what the closing behaviour does to flow, and what the evidence is that this happens in an intact human circulation rather than only in an isolated preparation.
Why a vessel with tone closes at a positive pressure
Module I3 established transmural pressure as the quantity that distends any vessel or chamber, the intravascular pressure minus the pressure immediately outside it, and Module I8 used it to explain the plateau of the venous return curve. In a human vein, which carries very little intrinsic wall tone, the vessel stays open while transmural pressure is positive and collapses when it reaches approximately zero. An arteriole does not behave that way, and the difference is the whole of the critical closing pressure.
An arteriolar wall is under active tension generated by circumferential smooth muscle. The law of Laplace relates the tension in the wall of a cylinder to the distending pressure and the radius.
Follow that expression as pressure falls. The vessel narrows, which reduces r. Because the tension generated by activated smooth muscle does not fall in proportion, the transmural pressure needed to keep the vessel open rises as the vessel gets smaller. The vessel is therefore in an unstable equilibrium: any narrowing increases the pressure required to resist further narrowing, so below a threshold the vessel does not settle at a smaller radius, it closes. Burton set this out formally in 1951 as the physical equilibrium of small blood vessels, and Nichol, Girling and colleagues in the same laboratory named the consequence in the title of the companion paper, the fundamental instability of small blood vessels and the critical closing pressures of vascular beds. Girling then examined the relationship between that closing pressure and venous pressure in 1952. The intravascular pressure at which the instability wins is the critical closing pressure.
Two properties follow immediately and both are load-bearing. Pcrit is not zero and it is not the surrounding tissue pressure, because it contains an active tension term. And Pcrit is not a constant, because that tension term is under continuous neural, humoral and metabolic control. It is best read as the sum of the pressure surrounding the vessel and the pressure equivalent of the tone in its wall.
The three states of a vessel approaching its closing pressure
Pressure falls continuously along an arteriole, so the interesting behaviour occurs at whichever point along the vessel the intravascular pressure first approaches the closing threshold.
Fully open. While intravascular pressure comfortably exceeds the closing pressure along the whole length, the lumen stays circular and the vessel behaves like a rigid tube. Flow is the pressure gradient divided by the resistance, in the ordinary way.
A flow-limiting segment forms. As pressure falls along the vessel it reaches the closing threshold at some point, usually near the distal end. The lumen there becomes elliptical and then slit-like, resistance at that point rises sharply, and a flow-limiting segment exists. From that moment the effective downstream pressure for everything upstream is the closing pressure, not whatever pressure exists beyond the segment.
Dynamic collapse and reopening. If pressure falls further the segment closes, flow through it stops, blood accumulates immediately upstream, upstream pressure rises, transmural pressure is restored above the threshold, and the segment reopens. Flow rarely ceases entirely. What results is a self-adjusting resistor holding the segment near its closing pressure, which is the definition of a Starling resistor. Permutt and Riley gave that behaviour its formal treatment in 1963, and Pinsky, Monge García and Dubin have recently restated the case for treating arterial critical closing pressures as genuine Starling resistors rather than as an artefact of the isolated-organ literature.
How broadly that Starling-resistor description applies during active arteriolar collapse remains debated. Miller and colleagues, in a recent mechanistic position paper, argue that, particularly near severe tone-dependent closure, the transition may behave more like a steep loss of conductance around a threshold than a broad, continuously operating waterfall regime. This does not negate the experimentally demonstrated zero-flow pressure or Magder's evidence against arterial compliance as its explanation. It cautions against assuming that Pcrit exerts the same physical role while the vascular bed is widely patent as it does near closure.
A useful way to carry Pcrit clinically is therefore to separate three operating states. When local arterial pressure lies comfortably above the closing threshold, the bed is open and flow is governed predominantly by ordinary pressure-flow relations and local regulation. Below the lower limit of autoregulation, flow can become pressure-dependent while the arterioles are still open. Only when local pressure approaches the closing threshold does Pcrit itself become flow-limiting. If the threshold exceeds the pressure available to that vascular territory, its conductance can fall dramatically or disappear.
This is the same physics as the venous waterfall of Module I8 and the pulmonary West zone behaviour of Module I15, and I1's table names all three as one phenomenon. The difference in the arteriolar case is the source of the surrounding force. On the venous side the collapsing pressure is supplied from outside the vessel, by the abdomen or the pleural space. Here it is supplied largely from inside the wall, by the smooth muscle. That is why the arteriolar waterfall has a lip that a drug can raise or lower, and the venous one does not.
The evidence that the circulation is not hydraulically continuous
The claim implied by all of this is strong enough that it deserves human evidence: that the systemic circulation is not one continuous pressure gradient from aorta to right atrium, but two circuits separated by a discontinuity. If that is true, then when flow stops the arterial and venous pressures should not meet.
They frequently do not. Wijnberge and colleagues studied 311 intensive care patients who had a cardiac arrest while arterial and central venous pressures were being actively recorded, and examined the pressures one minute after death. Arterial and central venous pressure reached an equilibrium state in only 52 percent of cases. In the other 48 percent the arterial pressure remained above the central venous pressure with no flow between them. Correcting for the difference in arterial and venous compliance changed the estimate of mean circulatory filling pressure by no more than 1.3 mmHg, so compliance mismatch does not explain the gap. Median mean circulatory filling pressure in that cohort was 15 mmHg, with an interquartile range of 12 to 18, which is a useful number in its own right.
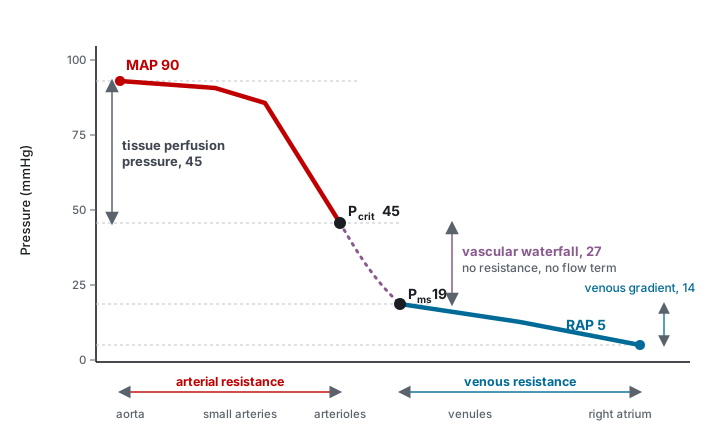
Maas and colleagues measured both ends of the discontinuity deliberately, in ten mechanically ventilated patients after cardiac surgery. Inspiratory hold manoeuvres at four levels transiently changed central venous pressure, arterial pressure and cardiac output, giving four points on a venous return curve and four on a ventricular output curve. Extrapolating each to zero flow gave the mean systemic filling pressure and the critical closing pressure in the same patient at the same moment. Mean systemic filling pressure was 18.7 (S.D. +/- 4.0 mmHg). Critical closing pressure was 45.5 (S.D. +/- 11.1 mmHg). The difference, 26.8 (S.D. +/- 10.7 mmHg), is the vascular waterfall, and it existed in every patient.
The corrected form of the equation
Now the arithmetic that makes the point. In the same patients Maas computed the two real resistances: arterial resistance, from mean arterial pressure down to the critical closing pressure, was 8.27 (S.D. +/- 4.45 mmHg·min/L), and venous resistance, from mean systemic filling pressure down to central venous pressure, was 2.75 (S.D. +/- 1.23). Their sum is 11.01. Total systemic vascular resistance, calculated conventionally from the full arterial-to-venous gradient, was 16.56 (S.D. +/- 8.57), significantly different from the sum of its parts.
The missing resistance is not missing. It is the waterfall being misfiled as resistance. Divide the measured 26.8 mmHg gradient across the waterfall by the cardiac output of about 5.5 L/min and you recover roughly 4.9 mmHg·min/L, which is close to the 5.5 unit discrepancy, and the residual is comfortably inside the measurement scatter. Total systemic vascular resistance, as every monitor computes it, is the sum of two genuine resistances plus a pressure drop that has nothing to do with resistance at all. The authors' own conclusion was blunt: measures of total systemic vascular resistance may become irrelevant in assessing systemic vasomotor tone.
That is what justifies writing the first interface with its downstream term made explicit rather than folded into the resistance.
It also puts a caveat under the second interface as the model states it. The gradient from Pcrit to Pms is written as a resistance multiplied by flow, and part of it genuinely is: blood does traverse capillaries and venules and does lose pressure to friction doing so. But part of that gradient is the waterfall, which is not a resistive drop and does not scale with flow. The Notion source for this material is careful to draw the distance between the closing pressure and the mean systemic filling pressure as a dotted line and to say that its extent is unknown, a carefulness worth preserving here too. Treat RII as a bookkeeping term that keeps the loop's arithmetic closed, not as a physical resistance you could go and measure.
What the measured number is, and what is still argued about it
Every bedside estimate of a critical closing pressure comes from extrapolating a pressure-flow relationship back to zero flow, and there is a long-standing objection to reading that intercept as a closing pressure at all. When inflow stops, arterial pressure does not fall to venous pressure immediately, and there are two candidate explanations: a Starling resistor holding pressure up because the downstream segments have closed, or compliant arteries still discharging their stored volume through the resistance in front of them, in which case the intercept reflects capacitance rather than closure.
Magder settled it experimentally in 1990, in the hind limbs of 18 anesthetized dogs with inflow measured directly, venous pressure controlled and collateral flow excluded. Venous pressure could be raised by 9.6 to 16.3 mmHg with no effect on arterial pressure at constant inflow, which is waterfall behaviour rather than the behaviour of a resistance in series. Lengthening the time taken to reach zero flow made the intercept fall steeply at first and then almost flatten for the next 5 to 10 seconds while arterial pressure remained far above venous pressure. And no value of arterial compliance could reproduce the observations if the true outflow pressure were the venous pressure. The Starling resistor is real, most likely precapillary, and in the resting limb it sits at 40 to 50 mmHg, which agrees closely with the human values above.
The caveat from the same paper is worth carrying. A zero-flow pressure obtained from a manoeuvre lasting less than about four seconds is also strongly influenced by capacitance and by the starting arterial pressure, so the measured closing pressure is method-dependent and two techniques will not necessarily agree in the same patient. Read a published value as an estimate of a real quantity rather than as the quantity itself.
What moves the critical closing pressure
Since Pcrit is the sum of a surrounding pressure and a wall tension, anything that changes either one changes it. The list is short and every entry is something seen daily.
| What changes | Effect on Pcrit | Effect on the perfusion gradient, MAP − Pcrit pressure margin |
|---|---|---|
| Alpha-adrenergic vasoconstriction | Rises | Depends entirely on whether MAP rises by more or by less |
| Vasoplegia of sepsis or of post-bypass vasoplegic syndrome | Falls, sometimes towards the venous pressure | Can be preserved or even widened at a low MAP |
| Local metabolic vasodilation | Falls in the active bed only | Widens in that bed, which is the point of the response |
| Raised intracranial pressure | Rises in the cerebral circulation | Narrows, which is the physiology behind cerebral perfusion pressure |
| Raised alveolar pressure | Rises in the pulmonary circulation | Narrows, which is West zone behaviour |
| Interstitial oedema, compartment syndrome, raised intra-abdominal pressure | Rises in the affected tissue | Narrows locally while the systemic MAP is unchanged |
| Hypoxia | Rose in hypoxic hypoxia, fell in carbon monoxide hypoxia | Moves in opposite directions in two conditions that look similar |
MAP − Pcrit is best treated as a derived margin between systemic arterial pressure and the estimated closing point, not automatically as the literal pressure gradient across an open capillary bed. Its significance becomes greatest as the operating pressure approaches the closing threshold.
The second row is the one that overturns bedside intuition, and there is now a human study of exactly that situation. Andrei and colleagues measured mean systemic pressure and critical closing pressure in 30 patients who developed vasoplegic hypotension within six hours of cardiac surgery and who had already failed a fluid challenge, before and after norepinephrine was started. The finding that frames everything else is the baseline: in these vasoplegic patients the waterfall, the difference between the closing pressure and the mean systemic pressure, was close to zero rather than the 27 mmHg Maas measured in an unselected group of patients after cardiac surgery.
Norepinephrine raised arterial pressure and calculated peripheral resistance in every patient. It restored the waterfall in only 19 of the 30. In those 19 the waterfall rose from a median of 3.47 mmHg to 43.6 mmHg, and with it cardiac index rose from 1.8 to 2.2 L/min/m2, capillary refill time shortened from 4.2 to 3.1 seconds, and the venous-to-arterial carbon dioxide gap fell from 9 to 6 mmHg. In the other 11 the waterfall did not change, and neither did cardiac index or capillary refill time. No baseline variable predicted which group a patient would fall into.
That is the cleanest published demonstration of the argument this module is making. Every patient got a higher blood pressure. About a third of them got nothing else, and the perfusion markers moved only where the waterfall was restored.
A subsequent analysis from the same group helps explain why capillary refill time may move with the vascular waterfall. Think first about what the CRT maneuver actually does: external pressure transiently empties blood from the skin microcirculation, and when that pressure is released the bed has to refill from the arterial side. The speed of that refill therefore depends, at least in part, on the pressure conditions governing arteriolar opening and downstream inflow. Critical closing pressure sits directly in that pathway: it represents the pressure threshold below which arterioles cease to conduct flow and reflects the interaction between vascular tone and surrounding pressure.
In 74 post-cardiac surgery patients, Andrei and colleagues found that shortening of CRT after haemodynamic treatment was associated with expansion of the vascular waterfall. More importantly, the association was carried predominantly by changes in Pcrit: ΔCRT correlated with ΔPcrit (ρ = −0.42, p < 0.001) but not with ΔPms (ρ = −0.03, p = 0.81). Patients with prolonged baseline CRT also had a much smaller vascular waterfall than those with normal CRT. In other words, when CRT improved, what moved with it was not the venous filling pressure but the arterial critical-closing behaviour upstream of the capillary bed.
The physiologic implication is not that a higher Pcrit is inherently better. Pcrit is a closing threshold, and its meaning depends on where it sits relative to the pressure available to that vascular bed. A rise in Pcrit may accompany restoration of vascular tone in vasoplegia, but an excessively high threshold can bring a vascular territory closer to flow limitation or closure. What the study suggests is narrower: CRT may provide a bedside signal that the arterial conditions governing arteriolar patency and refilling have changed, and that change appears to track Pcrit much more closely than Pms.
Whether this can be monitored rather than inferred is now a live question. Chandrasekhar and colleagues computed critical closing pressure continuously from routine invasive arterial monitoring, defined tissue perfusion pressure as mean arterial pressure minus critical closing pressure, and tested it in 5,988 cardiac intensive care admissions with external validation in 864 more at a second institution. It predicted mortality, length of stay and peak lactate, and carried information the other hemodynamic variables did not. That is evidence that the estimated quantity carries physiologically and prognostically relevant information, not yet an instruction to target it.
At first glance, these observations seem to point in opposite directions. In the Andrei responders, norepinephrine increased critical closing pressure relative to mean systemic pressure, restored the vascular waterfall, and this was accompanied by higher cardiac output and improvement in capillary refill time and the veno-arterial carbon dioxide gap. Yet Pcrit rose more than MAP, so the derived MAP − Pcrit pressure margin actually became smaller. Chandrasekhar and colleagues, in contrast, found that a larger MAP − Pcrit, which they termed tissue perfusion pressure (TPP), was associated with lower lactate and more favorable clinical outcomes.
The easiest way to reconcile them is to remember what Pcrit represents physically. Think of it first as a closing threshold. As long as the pressure reaching a vascular bed stays comfortably above that threshold, the arterioles remain open and flow is determined mainly by vascular tone, local regulation, and the pressure available across the bed. In profound vasoplegia, Pcrit may become very low because vascular tone has been lost. Restoring some tone can therefore raise Pcrit as part of returning the circulation toward a more regulated state. That appears to be what happened in the Andrei responders.
But the same rise in Pcrit is not always beneficial. If vascular tone becomes excessive, or if surrounding tissue pressure rises, the closing threshold can move closer to the pressure actually reaching that vascular bed. The margin for keeping the vessel open then becomes smaller. If local pressure falls below the threshold, conductance can fall sharply and the vascular territory may become effectively excluded from flow. In that sense, Pcrit is neither good nor bad by itself: its meaning depends on where it sits relative to the pressure available to the tissue.
This helps place TPP in context. It is useful as a measure of how far the operating arterial pressure lies above an estimated closing point, but it should not automatically be interpreted as the literal pressure gradient driving flow through an open capillary bed. A larger margin may mean that the circulation is operating farther from closure, whereas a smaller margin may mean that some vascular beds are getting closer to their threshold. What happens to actual tissue flow still depends on conductance, autoregulation, and regional vascular control.
There is also an important methodological reason not to make the two studies compete too literally. Andrei estimated Pcrit from pressure-flow relationships during inspiratory holds, whereas Chandrasekhar estimated it continuously from routine arterial monitoring. These approaches generate related zero-flow estimates, but they do not necessarily measure an identical physical quantity. Their values can therefore carry useful physiologic or prognostic information without being numerically interchangeable.
A final distinction is that Pcrit belongs to a vascular bed, not to the body as a whole. The skin, kidney, gut, brain, and other organs regulate their arterioles differently and may reach their closing thresholds at different pressures. A systemic Pcrit estimated from the arterial waveform or from a pressure-flow manoeuvre therefore cannot tell us exactly what is happening in every regional microcirculation. This is where the problem passes from Module I5 to Module I6 (opens in a new tab): an intervention may improve MAP, cardiac output, or an estimated Pcrit without guaranteeing that capillary flow improves in every tissue.
The practical conclusion is therefore deliberately modest. The Chandrasekhar data show that continuously estimated Pcrit and TPP contain prognostic information, while the Andrei studies show that changes in Pcrit and the vascular waterfall can accompany changes in bedside perfusion. Neither establishes that Pcrit, the vascular waterfall, or TPP should be maximized as a therapeutic target. The value of these measurements is in helping us understand where the circulation is operating relative to its pressure-flow limits, and then asking whether the tissues actually respond.
 At the bedside. When a vasopressor raises the mean arterial pressure and nothing else improves, the physiologic possibilities are specific rather than mysterious, and they are worth running through in order. The closing pressure may have risen in step with the arterial pressure, leaving the perfusion gradient unchanged. It may have risen by more, bringing one or more vascular beds closer to their closing threshold despite a higher MAP. Flow may have been redistributed away from a bed that was already marginal, or a regional vascular territory may have become flow-limited as local tone increased. Or the microcirculation downstream may be the problem, which is Module I6's territory. You cannot distinguish these from the pressure alone, and the calculated systemic vascular resistance will not do it either. What you can do is treat the pressure change as an intervention with an unknown result and go looking for the answer: capillary refill time, mottling, urine output, mentation, lactate trend and the carbon dioxide gap, measured before the change and again after it. A pressor titration without a paired perfusion measurement is a change you cannot interpret.
The role of diastolic blood pressure at the arteriolar level
The relevance of diastolic arterial pressure is often overlooked. Module I4 (opens in a new tab) established where it comes from: once the aortic valve closes, arterial pressure decays according to the arterial time constant and the time available before the next systole, so diastolic pressure reflects arterial compliance, peripheral vascular resistance and heart rate. Module I2 (opens in a new tab) then used that information clinically, treating a disproportionately low diastolic pressure, particularly when indexed to heart rate, as a bedside signal of vasoplegia. At the arteriolar level there is one further reason the diastolic pressure matters.
Module I3 (opens in a new tab) defined transmural pressure as the distending pressure across a vessel wall, and this module has now shown why an arteriole with active wall tension does not remain open simply because its intravascular pressure is above zero. It remains open only while the local arterial pressure is sufficient to overcome its critical closing pressure. Because a large fraction of each cardiac cycle is spent in diastole, the lowest arterial pressure reached during that cycle must remain above the closing pressure of the vascular beds being supplied. If local arterial pressure falls below Pcrit, distal small vessels become flow-limited and may collapse, interrupting flow from the arteriolar circulation into the downstream capillary network. In the four-interface framework, this is precisely what constitutes uncoupling of Interface II. Once the closing threshold exceeds the local intraluminal pressure, it is no longer useful to imagine an increasingly negative TPP. The relevant event is loss of conductance: that branch has crossed from pressure-dependent open flow toward closure.
Consider a profoundly vasodilated patient with an arterial pressure of 104/36 mmHg and a heart rate of 120 beats/min. The pulse pressure is wide, the diastolic pressure is strikingly low, and the diastolic shock index is 3.3, the pattern Module I2 (opens in a new tab) identified as severe loss of vascular tone. Now suppose the critical closing pressure of a particular vascular bed remains near 40 mmHg rather than falling in parallel with the systemic vasodilation. During part of every diastole, the arterial pressure reaching that bed can fall below its closing threshold. Systolic ejection may reopen the vessels on the next beat, but the transfer of flow from the arteriolar side into the capillary network has become intermittently limited. Macro-to-microcirculatory coupling may therefore become impaired, even though the monitor continues to display a systolic pressure above 100 mmHg and may show a seemingly acceptable mean pressure.
That qualification is essential. Vasodilation can lower both DBP and Pcrit, preserving coupling despite a low measured pressure. Conversely, regional tone, external compression or disordered local regulation may keep Pcrit relatively high while systemic DBP falls. Likewise, excessive vasoconstriction may raise both MAP and Pcrit, producing a normal or elevated MAP while narrowing the effective pressure available to the tissue. Macro-to-microcirculatory coupling therefore depends on the relationship between the arterial pressure delivered to a vascular bed and that bed's own closing pressure, not on MAP alone.
Under normal conditions, regional tissues continuously adjust arteriolar tone to match local metabolic demand, effectively determining how much of the available arterial pressure is translated into regional flow. When that local control is compromised by shock or overridden by therapy, the arteriolar-to-capillary interface may uncouple even while global hemodynamic variables appear corrected. DBP should therefore be read in two ways: as a macrocirculatory signal of arterial tone, as Modules I2 (opens in a new tab) and I4 (opens in a new tab) established, and as the lowest arterial pressure available during the cardiac cycle to maintain coupling across Interface II by remaining above the local critical closing pressure. Module I6 (opens in a new tab) takes the story downstream, where even an adequately pressurized and patent arteriolar bed may fail to achieve appropriate capillary recruitment and macro-to-microcirculatory coupling.
Autoregulation
Everything so far has treated the arteriole as a passive object with adjustable tone. It is not passive. Over a wide range of arterial pressures most vascular beds hold their own blood flow nearly constant by adjusting that tone continuously, which means the flow reaching an organ is not a function of the arterial pressure in any simple sense. This is autoregulation, and four mechanisms contribute.
- Myogenic. Vascular smooth muscle responds directly to a change in transmural pressure, constricting when it is stretched and relaxing when it is not. Bayliss described this in 1902 as the local reaction of the arterial wall to changes of internal pressure, and it remains the fastest of the four, operating within seconds and independent of any nerve or circulating factor.
- Metabolic. Falling local oxygen tension and the accumulation of adenosine, potassium, hydrogen ion, carbon dioxide, lactate and inorganic phosphate all dilate the supplying arteriole. This is the mechanism that matches flow to demand rather than to pressure, and it is why an exercising or septic tissue can pull more flow than its neighbour at the same arterial pressure.
- Endothelial. Nitric oxide, prostanoids and other endothelium-derived mediators, released in response to shear stress and to local signals, modulate the smooth muscle from immediately inside the vessel. This is the mechanism most disturbed by sepsis and by endothelial injury.
- Neurohumoral. Sympathetic tone and circulating catecholamines set the background level around which the local mechanisms operate. They act on the whole bed rather than on the locally active part of it, which is why a systemic vasopressor is a blunt instrument compared with the endogenous local control it overrides.
The plateau is a trajectory, not a curve
The familiar autoregulation diagram, flow flat across a range of pressures, invites a misreading that is worth correcting because it is the misreading that makes Pcrit look like a fixed back-pressure. The plateau is not a pressure-flow relationship. It is the path traced across a whole family of pressure-flow relationships as tone changes.
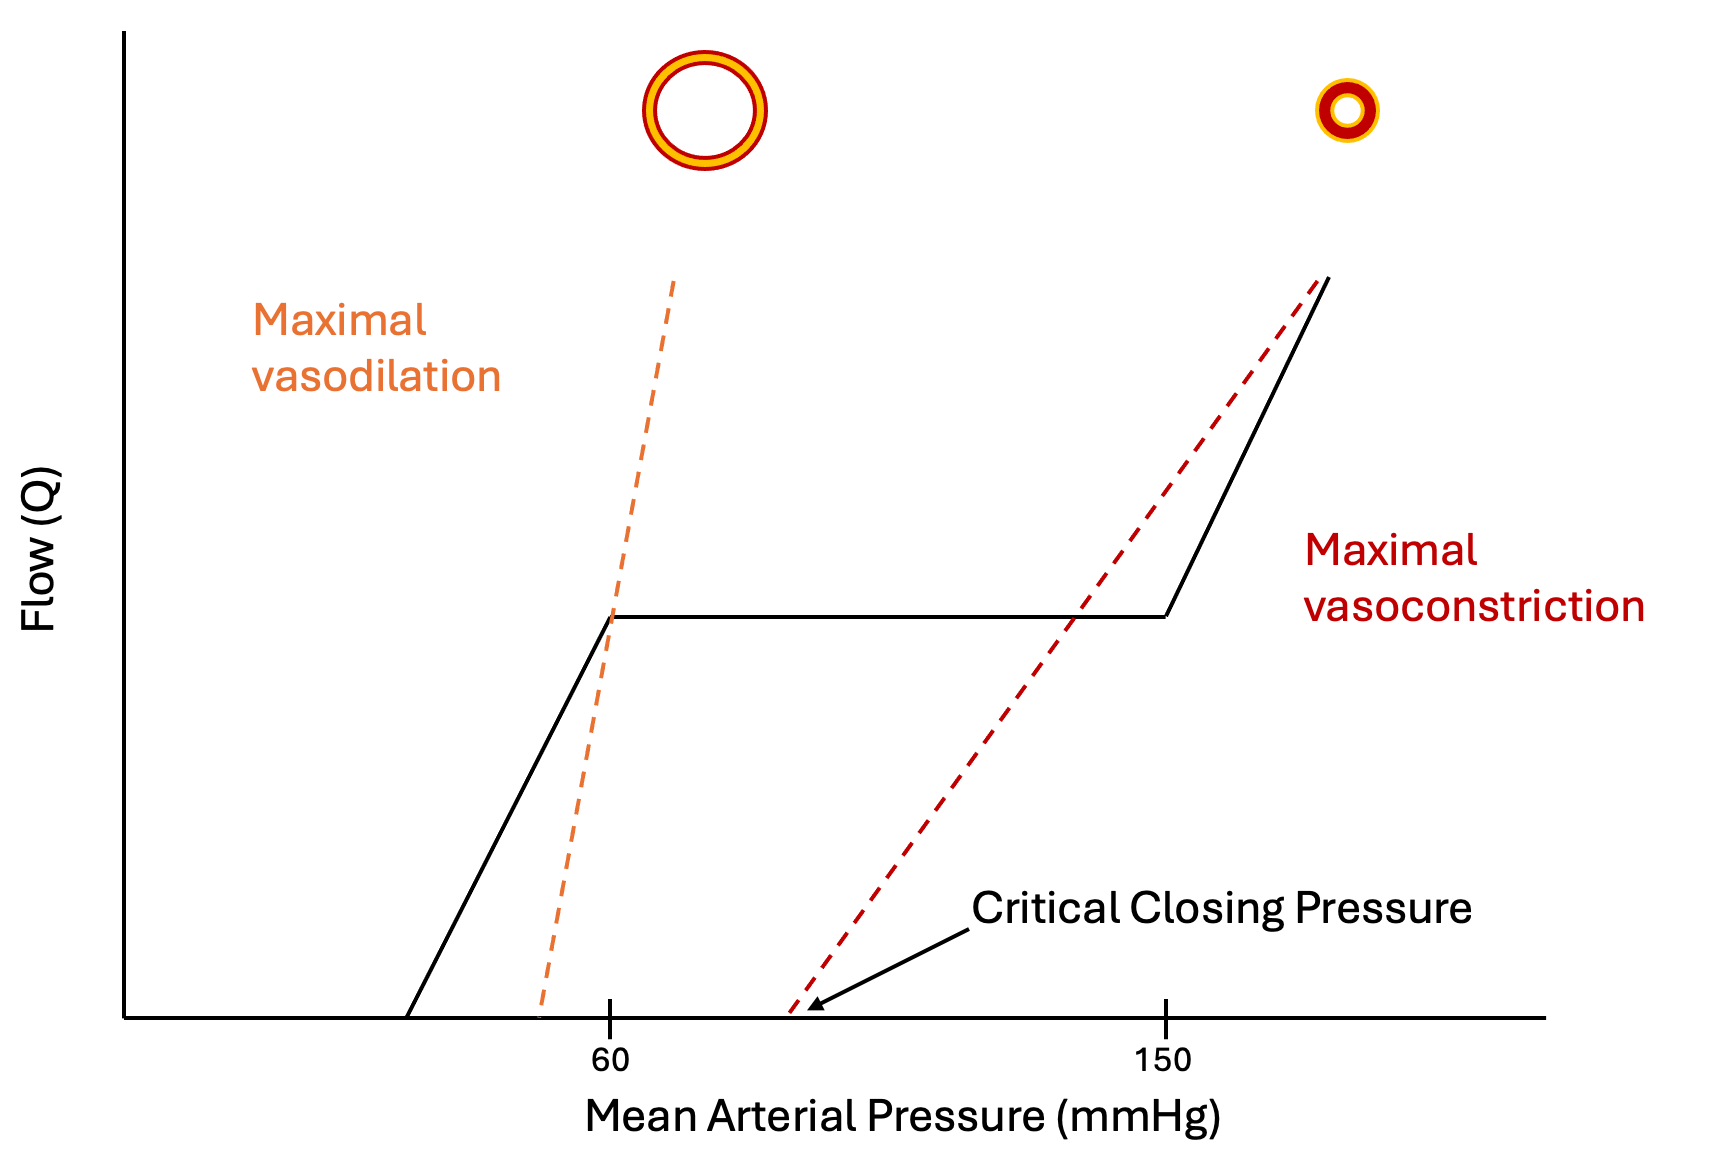
Reading it this way disposes of a persistent confusion. Tissue perfusion pressure is usually written as mean arterial pressure minus critical closing pressure, which treats the closing pressure as a static back-pressure of the kind central venous pressure is often mistaken for. It is nothing of the sort. It is the zero-flow intercept of the arterial input circuit, a property of wall tone, and it moves whenever tone moves. Within the autoregulatory range, arteriolar pressure sits well above the closing threshold and flow is governed by active adjustment of conductance rather than by a subtraction. The subtraction becomes the dominant description at the extremes, where tone is fixed and the pressure-flow relationship really is a straight line with an intercept. In extreme vasoconstriction, pharmacologic or from flow diversion away from non-vital beds in shock, the closing pressure can approach or exceed the arterial pressure and flow to that bed stops.
Regulating flow is not the same as regulating capillary pressure
One further nuance hands off directly to the next two modules. Total flow through a bed depends on the sum of the arterial and venous resistances, while the hydrostatic pressure inside the capillary, which determines filtration, depends on the ratio of venous to arterial resistance. Regulating one does not regulate the other. Davis measured both in the wing of the unanesthetized bat, with intravital microscopy for vessel diameter and red cell velocity and a servo-null system for capillary pressure, while perfusion pressure was lowered. Arterioles of every branching order dilated, total flow stayed nearly constant, and capillary pressure was regulated only about 60 percent. A bed with beautifully autoregulated flow can therefore be running a capillary pressure well away from normal in either direction, which is where fluid moves into and out of the interstitium, and it is one reason oedema and hypoperfusion are not opposite findings.
The range is not the same in every patient
The canonical autoregulatory range, roughly 60 to 150 mmHg, describes a healthy adult brain. It is not a property of a species, it is a property of a vascular bed in a particular person on a particular day, and three kinds of departure matter clinically.
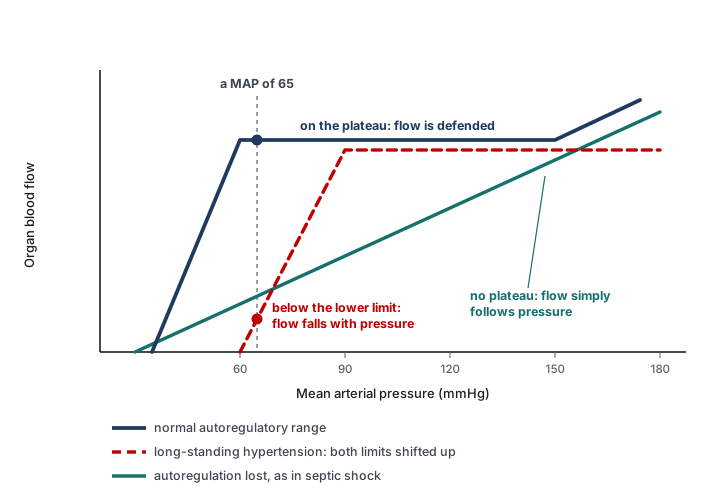
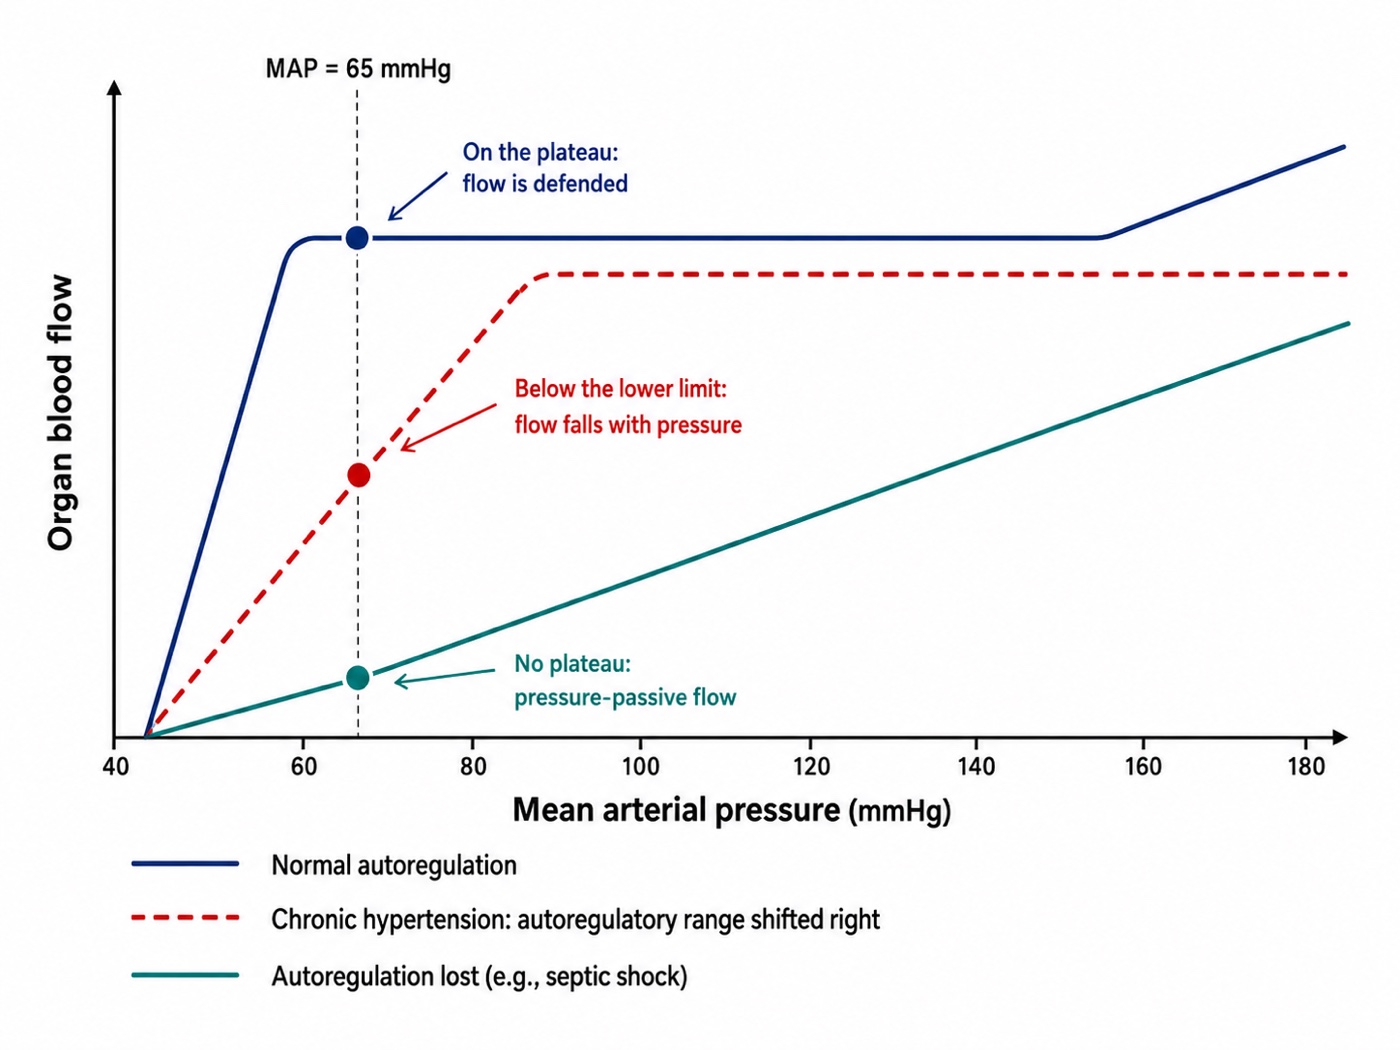
Long-standing hypertension shifts the range upward. Strandgaard, Olesen, Skinhoj and Lassen measured cerebral blood flow in patients with severe hypertension and in normotensive controls, lowering the blood pressure in each to find the pressure at which flow began to fall. Both the lower limit of autoregulation and the pressure at which brain hypoxia appeared were shifted upward in the hypertensive patients, an adaptation they attributed to hypertrophy of the arteriolar walls. A hypertensive patient resuscitated to a mean arterial pressure that would be entirely adequate in a normotensive one may be sitting below the lower limit of their own autoregulatory range, with organ flow already pressure-dependent.
Critical illness degrades the range. Schramm and colleagues assessed cerebral autoregulation daily in 30 patients with severe sepsis or septic shock, correlating transcranial Doppler flow velocity against the invasive arterial pressure trace to derive an index of autoregulation. Autoregulation was impaired in 60 percent of patients on day 1, 59 percent on day 2, 41 percent on day 3 and 46 percent on day 4, and impairment on day 1 was associated with the later development of sepsis-associated delirium. In a patient whose autoregulation has failed, organ flow follows arterial pressure passively, which is the line without a plateau in the figure and the one situation in which a pressure target behaves the way clinicians implicitly assume it does.
The range differs by organ, and the kidney is the one to worry about. Post and Vincent, reviewing renal autoregulation in circulatory shock, make the point that renal pressure-flow relationships vary substantially between patients according to comorbidity and to the character of the shock, and that this variability is precisely why personalized pressure management matters. The kidney also has the least reserve when its autoregulation is exhausted, which is why renal endpoints are where the signal in the mean arterial pressure target trials keeps turning up.
Choosing a mean arterial pressure target for an individual patient
The physiology above predicts something specific about randomized trials of a fixed pressure target: they should be neutral overall, because a single number lands in a different place on every patient's autoregulatory curve, and any real effect should appear in the subgroups where the curve is predictably displaced. That is close to what the trials found.
SEPSISPAM randomized 776 patients with septic shock to a mean arterial pressure target of 80 to 85 mmHg or 65 to 70 mmHg. Mortality at 28 days was 36.6 percent in the high-target group and 34.0 percent in the low-target group, with no significant difference, and no difference at 90 days either. The high-target group had a higher incidence of newly diagnosed atrial fibrillation, which is the cost of the extra vasopressor. The prespecified finding worth carrying is in the subgroup: among patients with chronic hypertension, those assigned to the higher target required less renal-replacement therapy, though this did not translate into a mortality difference. That is the Strandgaard shift showing up in a clinical endpoint.
The 65 trial approached it from the other direction, randomizing 2,600 patients aged 65 or older with vasodilatory hypotension to permissive hypotension, a target of 60 to 65 mmHg, or to usual care. The permissive group received less vasopressor, by a median of 5 hours of exposure and 8.7 mg of norepinephrine equivalents. Mortality at 90 days was 41.0 percent against 43.8 percent, an absolute risk difference of minus 2.85 percent with a 95 percent confidence interval from minus 6.75 to plus 1.05 and a P value of 0.15. Adjusted for prespecified baseline variables the odds ratio was 0.82. The trial is formally negative and the confidence interval does not exclude a worthwhile benefit of accepting a lower pressure in older patients.
The OVATION pilot, 118 patients randomized to 60 to 65 against 75 to 80 mmHg, achieved a 9 mmHg separation and was designed to establish feasibility rather than to answer the clinical question. Its subgroup observation, that among patients aged 75 or older hospital mortality was 13 percent with the lower target against 60 percent with the higher, involves very few patients and belongs in the hypothesis column. It is reported here because it is often repeated without that caveat.
The physiologic reading of all three is the same. A fixed target tests whether one number suits an unselected population, and it does not suit them differently enough to move an unselected mortality endpoint. The number still matters, and it is not the same number in every patient. Three things narrow it down at the bedside: the premorbid blood pressure, because it locates the autoregulatory range, the organ at risk, because an acute kidney injury and an arrhythmia assign opposite costs to the same 10 mmHg, and the response to a deliberate change, because a pressure target is a hypothesis and a hypothesis can be tested.
Magder states the underlying problem more precisely than the trial literature does. Blood pressure is determined by total flow and total resistance, but the distribution of that flow among vascular beds depends on the relative resistances of those beds, and it is the distribution that determines whether any given organ is perfused. If the regional resistances were known they would be the ideal guide to therapy. They cannot be measured clinically, so we are left with blood pressure as a proxy for something it does not describe. That is not an argument for ignoring the pressure. It is an argument for treating it as one input, for expecting empiric targets to underperform in unselected populations, and for individualizing within whatever range a trial has shown to be safe.
 Physiologic insight A vasopressor can raise the mean arterial pressure and lower tissue flow at the same time, and there are three separate routes by which it does so, which is why the net effect is genuinely unpredictable rather than merely hard to guess. It raises the critical closing pressure, so the perfusion gradient may narrow even as its upstream end rises. It raises left ventricular afterload, which Module I4 develops, so stroke volume may fall in a ventricle that is operating close to its limit. And it constricts the whole bed rather than the locally active part of it, overriding the metabolic control that was directing flow to the tissue that needed it. Against these it recruits unstressed to stressed volume and raises the mean systemic filling pressure, which raises venous return, and through beta-1 activity it raises contractility, both of which Module I8 documents with human data. Norepinephrine is therefore not a pressure drug with side effects. It is an intervention on at least five variables at once, and the only way to know which of them dominated in a given patient is to measure something downstream of all of them.
Not all MAPs are equal
The phrase is the summary of this module. Module N3 introduced it as a warning, that a mean arterial pressure is a poor surrogate for oxygen delivery because the assumptions behind it fail in the intensive care unit. By now it can be stated as three distinct failure modes rather than as a caution. Two patients can have the same mean arterial pressure and different tissue perfusion for reasons that are physically different from each other and that call for different responses.
| MAP | Pcrit | Perfusion gradient | CO | SVR | What is actually wrong, and what helps |
|---|---|---|---|---|---|
| 65 | Low, near 20 | Wide, about 45 | High | Low | Nothing at this interface. Vasoplegia with a preserved gradient and adequate flow. Raising the pressure buys nothing here |
| 65 | High, near 50 | Narrow, about 15 | Low or normal | High | Excessive tone. The margin above the closing threshold is small. If local pressure approaches or falls below the bed's Pcrit, conductance becomes threatened and further vasopressor may worsen regional perfusion |
| 85 | High, near 55 | Narrow, about 30 | Normal | High | The pressure was corrected, but the margin above the estimated closing threshold increased much less. A reassuring MAP therefore does not guarantee that every vascular bed moved farther from closure |
| 65 | Moderate, near 40 | Adequate globally, about 25 | Normal | Normal | Maldistribution between parallel beds. The global numbers cannot see it, and the regional markers can |
The first mechanism is the gradient itself, MAP minus Pcrit, which can be narrow at a normal pressure and wide at a low one. The second is the position of that pressure on the patient's own autoregulatory curve, which is displaced upward by chronic hypertension and flattened or abolished by critical illness. The third is the distribution of flow between parallel beds, which a single global pressure and a single global resistance cannot describe at all. A fourth mechanism sits beyond this interface, in the microcirculation itself, and it is the subject of the next module.
This is what macro-to-micro coupling means, and the source material for this curriculum states it bluntly: resuscitation is an act of faith. We manipulate the variables we can see in the belief that improving them improves capillary perfusion and ultimately cellular respiration. When that belief holds the system is coupled and the bedside markers move with the numbers. When it does not, further fluid and further vasopressor do not reach the tissue, and they accumulate as oedema, congestion and organ dysfunction instead. The apparatus of perfusion markers in Module I11 exists because coupling cannot be assumed.
Interface II ends at the arteriolar outlet, and the accurate position at that boundary is that we have accounted for the pressure and only partly for the flow. The gradient driving blood into the tissue is now defined, its downstream term has a mechanism, and the reasons a given mean arterial pressure may be adequate for one patient and not another are physiologic rather than idiosyncratic. What remains unaccounted for is everything that happens after the blood enters a capillary network with its own regulation and its own pathology, which is where Module I6 takes over with the loss of hemodynamic coherence. Beyond the capillary, Module I7 picks up the Starling forces, and Module I8 shows the same waterfall physics operating a second time at the entrance to the chest. Castro, Kattan and colleagues, with Pinsky, have recently extended the waterfall framework across the whole loop, from the arterial closing pressure derived here to the venous congestion that appears when the same mechanism runs in reverse, which is a good indication that this is one idea and not four.
References
- Burton AC. On the physical equilibrium of small blood vessels. Am J Physiol. 1951;164(2):319-329. doi:10.1152/ajplegacy.1951.164.2.319.
- Nichol J, Girling F, Jerrard W, Claxton EB, Burton AC. Fundamental instability of the small blood vessels and critical closing pressures in vascular beds. Am J Physiol. 1951;164(2):330-344. doi:10.1152/ajplegacy.1951.164.2.330.
- Girling F. Critical closing pressure and venous pressure. Am J Physiol. 1952;171(1):204-207. doi:10.1152/ajplegacy.1952.171.1.204.
- Bayliss WM. On the local reactions of the arterial wall to changes of internal pressure. J Physiol. 1902;28(3):220-231. doi:10.1113/jphysiol.1902.sp000911. Free full text.
- Permutt S, Riley RL. Hemodynamics of collapsible vessels with tone: the vascular waterfall. J Appl Physiol. 1963;18:924-932. doi:10.1152/jappl.1963.18.5.924.
- Sylvester JT, Gilbert RD, Traystman RJ, Permutt S. Effects of hypoxia on the closing pressure of the canine systemic arterial circulation. Circ Res. 1981;49(4):980-987. doi:10.1161/01.res.49.4.980.
- Sylvester JT, Goldberg HS, Permutt S. The role of the vasculature in the regulation of cardiac output. Clin Chest Med. 1983;4(2):111-126. PMID 6342918.
- Davis MJ. Control of bat wing capillary pressure and blood flow during reduced perfusion pressure. Am J Physiol. 1988;255(5 Pt 2):H1114-H1129. doi:10.1152/ajpheart.1988.255.5.H1114.
- Magder S. Starling resistor versus compliance. Which explains the zero-flow pressure of a dynamic arterial pressure-flow relation? Circ Res. 1990;67(1):209-220. doi:10.1161/01.res.67.1.209.
- Strandgaard S, Olesen J, Skinhoj E, Lassen NA. Autoregulation of brain circulation in severe arterial hypertension. Br Med J. 1973;1(5852):507-510. doi:10.1136/bmj.1.5852.507. Free full text.
- Maas JJ, de Wilde RB, Aarts LP, Pinsky MR, Jansen JR. Determination of vascular waterfall phenomenon by bedside measurement of mean systemic filling pressure and critical closing pressure in the intensive care unit. Anesth Analg. 2012;114(4):803-810. doi:10.1213/ANE.0b013e318247fa44. Free full text.
- Schramm P, Klein KU, Falkenberg L, Berres M, Closhen D, Werhahn KJ, David M, Werner C, Engelhard K. Impaired cerebrovascular autoregulation in patients with severe sepsis and sepsis-associated delirium. Crit Care. 2012;16(5):R181. doi:10.1186/cc11665. Free full text.
- Asfar P, Meziani F, Hamel JF, Grelon F, Megarbane B, Anguel N, Mira JP, Dequin PF, Gergaud S, Weiss N, Legay F, Le Tulzo Y, Conrad M, Robert R, Gonzalez F, Guitton C, Tamion F, Tonnelier JM, Guezennec P, Van Der Linden T, Vieillard-Baron A, Mariotte E, Pradel G, Lesieur O, Ricard JD, Hervé F, du Cheyron D, Guerin C, Mercat A, Teboul JL, Radermacher P. High versus low blood-pressure target in patients with septic shock. N Engl J Med. 2014;370(17):1583-1593. doi:10.1056/NEJMoa1312173.
- Magder SA. The highs and lows of blood pressure: toward meaningful clinical targets in patients with shock. Crit Care Med. 2014;42(5):1241-1251. doi:10.1097/CCM.0000000000000324.
- Lamontagne F, Meade MO, Hébert PC, Asfar P, Lauzier F, Seely AJE, Day AG, Mehta S, Muscedere J, Bagshaw SM, Ferguson ND, Cook DJ, Kanji S, Turgeon AF, Herridge MS, Subramanian S, Lacroix J, Adhikari NKJ, Scales DC, Fox-Robichaud A, Skrobik Y, Whitlock RP, Green RS, Koo KKY, Tanguay T, Magder S, Heyland DK. Higher versus lower blood pressure targets for vasopressor therapy in shock: a multicentre pilot randomized controlled trial. Intensive Care Med. 2016;42(4):542-550. doi:10.1007/s00134-016-4237-3.
- Post EH, Vincent JL. Renal autoregulation and blood pressure management in circulatory shock. Crit Care. 2018;22(1):81. doi:10.1186/s13054-018-1962-8. Free full text.
- Lamontagne F, Richards-Belle A, Thomas K, Harrison DA, Sadique MZ, Grieve RD, Camsooksai J, Darnell R, Gordon AC, Henry D, Hudson N, Mason AJ, Saull M, Whitman C, Young JD, Rowan KM, Mouncey PR. Effect of reduced exposure to vasopressors on 90-day mortality in older critically ill patients with vasodilatory hypotension: a randomized clinical trial. JAMA. 2020;323(10):938-949. doi:10.1001/jama.2020.0930. Free full text.
- Wijnberge M, Schuurmans J, de Wilde RBP, Kerstens MK, Vlaar AP, Hollmann MW, Veelo DP, Pinsky MR, Jansen JRC, Geerts BF. Defining human mean circulatory filling pressure in the intensive care unit. J Appl Physiol (1985). 2020;129(2):311-316. doi:10.1152/japplphysiol.00298.2020. Free full text.
- Andrei S, Bar S, Nguyen M, Bouhemad B, Guinot PG. Effect of norepinephrine on the vascular waterfall and tissue perfusion in vasoplegic hypotensive patients: a prospective, observational, applied physiology study in cardiac surgery. Intensive Care Med Exp. 2023;11(1):52. doi:10.1186/s40635-023-00539-x. Free full text.
- Chandrasekhar A, Padrós-Valls R, Pallarès-López R, Palanques-Tost E, Houstis N, Sundt TM, Lee HS, Sodini CG, Aguirre AD. Tissue perfusion pressure enables continuous hemodynamic evaluation and risk prediction in the intensive care unit. Nat Med. 2023;29(8):1998-2006. doi:10.1038/s41591-023-02474-6. Free full text.
- Pinsky MR, Monge García MI, Dubin A. Significance of critical closing pressures (Starling resistors) in arterial circulation. Crit Care. 2024;28(1):127. doi:10.1186/s13054-024-04912-4. Free full text.
- Castro R, Kattan E, Retamal J, Hernández G, Pinsky MR. Venous congestion from a vascular waterfall perspective: reframing congestion as a dynamic Starling resistor phenomenon. Intensive Care Med Exp. 2025;13(1):119. doi:10.1186/s40635-025-00828-7. Free full text.
- Miller A, Rola P, Spiegel R, Haycock K. Arteriolar Collapse and Haemodynamic Incoherence in Shock: Rethinking Critical Closing Pressure. J Pers Med. 2026;16(2). doi:10.3390/jpm16020078. Free full text.
- Andrei S, Bar S, Nguyen M, Bouhemad B, Longrois D, Guinot PG. Capillary refill time changes are associated with Vascular Waterfall response in post-cardiac surgery patients. Ann Intensive Care. 2026;16:100105. doi:10.1016/j.aicoj.2026.100105. Free full text.