Module I6
Microcirculation and the vascular waterfall
Module I5 followed the pressure down the arterial tree and stopped at the arteriolar outlet, at the critical closing pressure. Everything past that point is a different circulation with different rules, and it is the only part of the cardiovascular system where the work done by the other three interfaces is actually collected.
Up to the arteriole the circulation moves blood in bulk, and pressure and flow are the useful variables. Past it none of that holds. Oxygen reaches a mitochondrion by diffusion over tens of micrometres, and diffusion does not care what the mean arterial pressure is. It cares whether a capillary carrying red cells lies close enough to the cell that needs them. The variable governing tissue oxygenation at this scale is therefore not a pressure and not a flow, but the number of capillaries actually conducting flow and how evenly they are distributed.
That change of variable produces the central claim of the module. Restoring blood pressure and cardiac output does not reliably restore capillary perfusion. When the two move together the relationship is called macro-to-microcirculatory coupling, and resuscitation guided by systemic targets works because said coupling holds. In inflammation and infection it can fail, and when it fails the macrocirculatory numbers keep improving while the tissue stays in shock.
One boundary before starting. Module I11 already teaches capillary refill time, mottling, lactate, central venous oxygen saturation and the carbon dioxide gap as bedside instruments, with their thresholds and their evidence. This module supplies the physiology that explains why those instruments read as they do, and where the mechanism sets a limit on what a reading can mean.
The microcirculation is a circulation, not a destination
Anatomically the microcirculation is everything below roughly 100 micrometres: terminal arterioles, the capillary networks they feed, and the postcapillary venules that drain them. Functionally it is defined by two properties no other segment shares. It is the only site of diffusive exchange, and its calibre is set predominantly by local signals: metabolic mediators from the parenchyma, endothelial mediators including nitric oxide and prostacyclin, and the myogenic response of smooth muscle to transmural pressure, with sympathetic tone acting on top. The first three are generated inside the tissue being perfused, which is what makes this a circulation in its own right rather than the downstream end of the arterial one.
The distinction that carries the most clinical weight is between anatomical and functional capillary density. Anatomical density is how many capillaries exist in a field. Functional density, usually reported as perfused capillary density or the proportion of perfused vessels, is how many of them are carrying red cells at the time of the measurement. Sepsis does not destroy capillaries, at least not early. It stops them.
Edul and colleagues measured this with sidestream dark field imaging in 25 patients with septic shock and 25 volunteers, using the parameters the European Society of Intensive Care Medicine task force later standardised. Total capillary density was identical, 16.9 against 16.7 mm/mm2. Perfused capillary density was not, 13.2 against 16.6. The proportion of perfused capillaries fell from 1.00 to 0.78, the microvascular flow index from 2.97 to 2.15 and red cell velocity from 1332 to 830 micrometres per second, while the heterogeneity flow index rose from 0.25 to 1.64. The study also rejected a common intuition: hyperdynamic microvascular flow was absent, with only 4 percent of capillaries exceeding the seventy-fifth percentile velocity of the volunteers. The septic microcirculation is not a bed racing blood past the tissue. It is a bed in which some capillaries have slowed and others have stopped.
Why heterogeneity, and not mean flow, is the lesion
A tissue supplied by a network of parallel capillaries does not experience the average. Each capillary supplies a cylinder of tissue around it and oxygen reaches the far edge of that cylinder by diffusion. When a capillary stops, the supply to its cylinder does not halve, it goes to zero, and the capillary 60 micrometres away cannot reach across no matter how fast it flows. Doubling the flow in the vessels that remain open therefore buys nothing for the tissue that has been cut off, which is a very different situation from a uniform reduction in flow, where every cell gets less and every cell can be helped by giving more.
Ellis and colleagues showed both halves of this in septic rat skeletal muscle, measuring erythrocyte oxygen saturation capillary by capillary. Sepsis raised the proportion of stopped-flow capillaries from 10 to 38 percent. In the capillaries still flowing, the saturation entering at the arteriolar end was unchanged while the saturation leaving at the venular end fell from 58.4 to 38.5 percent, and capillary oxygen extraction increased threefold, in direct proportion to the degree of stopped flow. The tissue beside an open capillary is stripping it far harder than normal in an attempt to cover for its neighbours, while the tissue beside a stopped one gets nothing at all.
Now consider the venous blood coming out of that tissue. A venous sample is not an average over tissue. It is an average over flow.
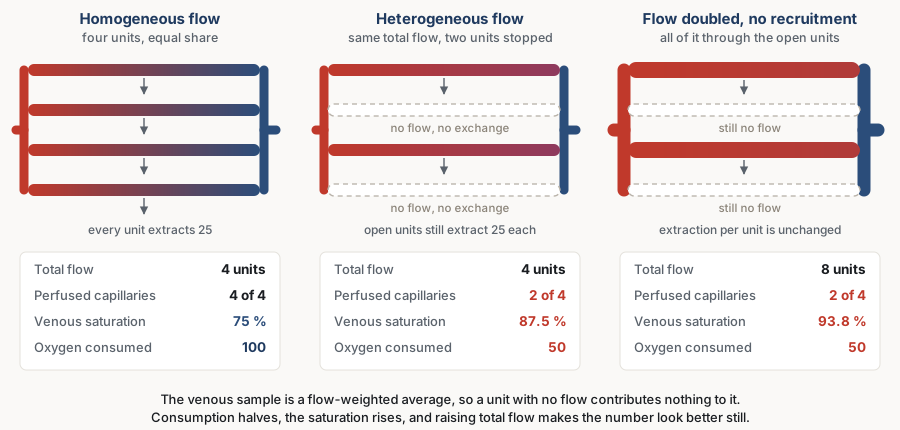
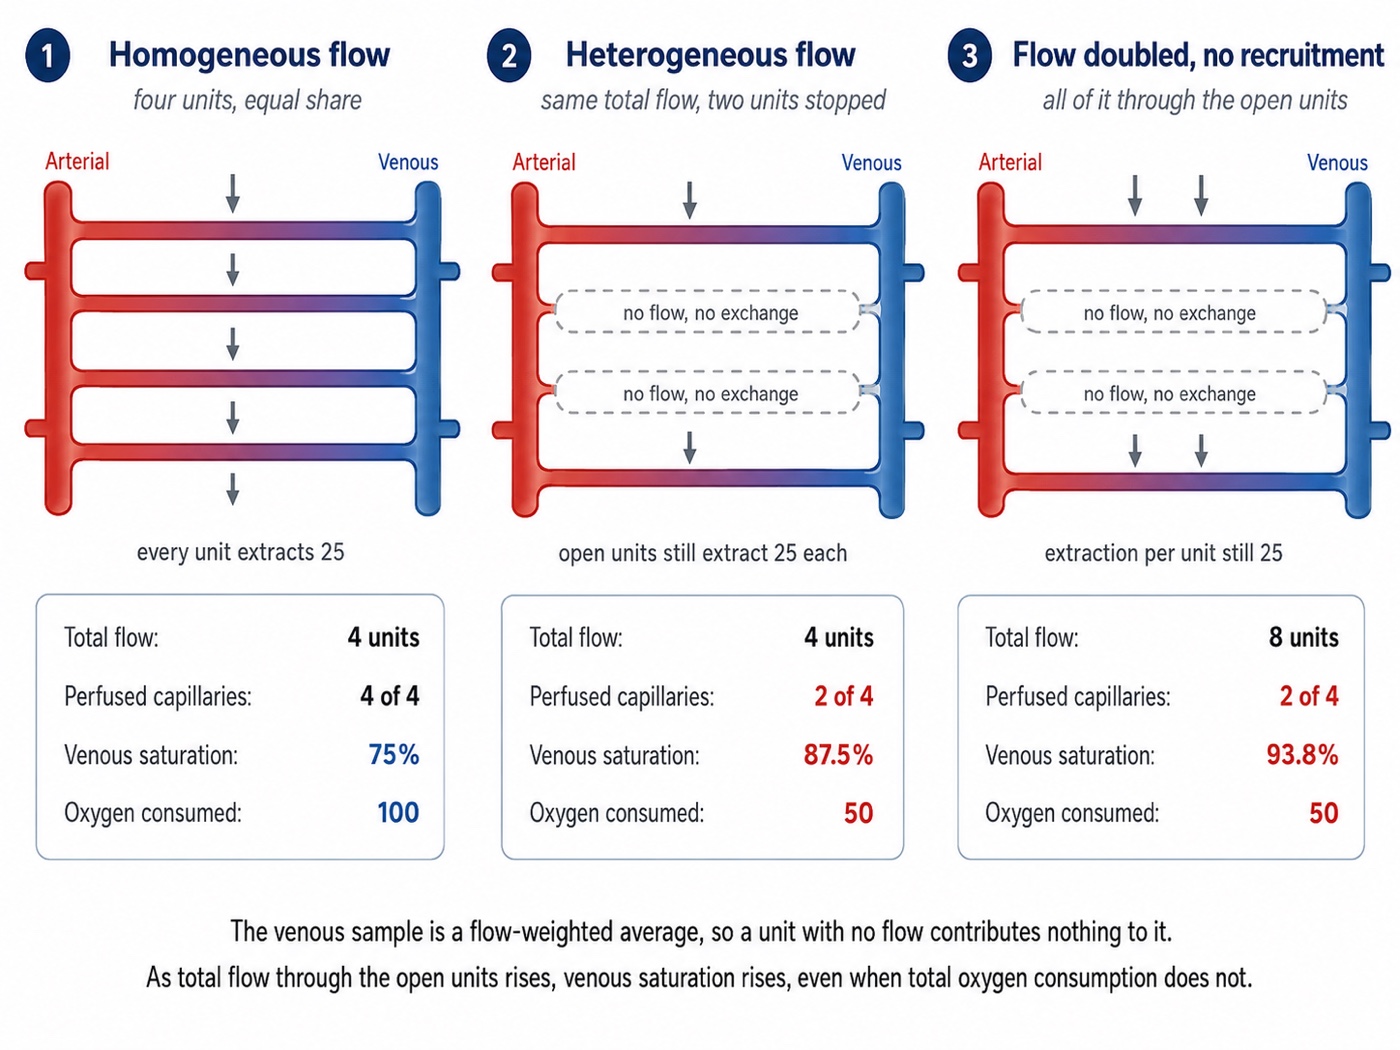
Work the numbers once. Four units carry equal flow and each gives up 25 units of oxygen, so consumption is 100 and venous saturation is 75 percent. Stop two without changing total flow. The survivors carry double, their tissue still needs only 25 each, so their outflow saturation rises to 87.5 percent. Consumption has halved and half the tissue is anaerobic, yet the venous saturation has gone up. Now double the cardiac output without opening the closed units, which is what an inotrope does in a bed that cannot recruit: outflow saturation rises again to 93.8 percent and consumption is still 50.

Macro-to-microcirculatory coupling, and what its loss predicts
Macro-to-microcirculatory coupling is the condition in which correcting systemic haemodynamic variables also corrects regional and microcirculatory perfusion, and it is the premise that makes a pressure-and-flow resuscitation strategy rational. Ince's argument is that in inflammation and infection the vascular regulation that maintains coupling is itself damaged, so the microcirculation can remain in shock after the macrocirculation has been repaired. He separates four alterations, and they are worth holding apart because they call for different responses.
| Type | What is wrong | Why a macrocirculatory target misses it |
|---|---|---|
| 1. Heterogeneous flow | Some capillaries stopped and others fast in the same field. Functional density falls while anatomical density does not. The dominant lesion of sepsis | Extra flow goes preferentially to units already open, so the mean improves and the distribution does not |
| 2. Reduced capillary density | Fewer red cell carrying capillaries per unit tissue, from haemodilution and anaemia. Aggressive crystalloid, cardiopulmonary bypass | Convection is adequate and the carrying capacity of the bed is not. Cardiac output can be high while the tissue is short of red cells |
| 3. Vasoconstriction or tamponade | Perfusion pressure across the bed collapses, from arteriolar constriction or from a rise in the pressure surrounding the vessels. High vasopressor dose, intra-abdominal hypertension, oedema compressing its own supply | The measured arterial pressure is upstream of the constriction, so it can be normal while the pressure driving flow into the tissue is not |
| 4. Tissue oedema | Diffusion distance between capillary and cell increases. Capillary leak, positive fluid balance | Convection is intact and diffusion is not. No haemodynamic variable reports it |
The observational evidence is large and consistent. De Backer and colleagues pooled 252 patients with severe sepsis studied by sublingual videomicroscopy. Their global variables were close to target: mean arterial pressure 70 mmHg, cardiac index 3.3 L/min/m2, central venous saturation 68.3 percent. Their microcirculations were not: the proportion of perfused small vessels was 65 percent and the heterogeneity of that proportion was 35 percent. Perfused small vessel density was the strongest predictor of outcome in the dataset, area under the curve 0.818, and survival fell across its quartiles from 70 and 75 percent in the two best to 44 and 3 percent in the two worst. Microcirculatory variables predicted death better than the haemodynamic variables measured at the same moment, which is only possible if the two are partly independent. Trzeciak and colleagues had found the same separation earlier during protocolised early goal-directed therapy, where flow velocity and flow heterogeneity distinguished survivors from non-survivors.
Two studies fix the character of the lesion. In the original description, sublingual vessel density in 50 patients with severe sepsis was modestly reduced, 4.5 against 5.4 per mm in volunteers, but the proportion of perfused small vessels collapsed, 48 against 90 percent, worse in non-survivors. The finding worth memorising is the control experiment: topical acetylcholine completely reversed the abnormality. The vessels were not obstructed and they were not gone. They were closed, by a regulatory failure a local vasodilator could override. Sakr and colleagues then followed 49 patients with septic shock daily. At the onset survivors and non-survivors were indistinguishable, at 65 and 58 percent perfused small vessels, and what separated them was the trajectory, which improved in survivors and did not in those who died. Patients who died in multiple organ failure after their shock had formally resolved, with matched haemodynamics, oxygenation and vasopressor use, still had 57.4 percent perfused vessels against 79.3 percent. One microcirculatory measurement is a weak prognostic statement and its direction of change over the first day or two is a strong one, which is exactly the pattern the bedside markers show.
Testing coupling by intervening
The observational studies show that the two circulations can be dissociated. Three interventional studies show something sharper, that the microcirculatory effect of a haemodynamic intervention cannot be predicted from its macrocirculatory effect.
| Intervention | Macrocirculatory effect | Microcirculatory effect |
|---|---|---|
| Norepinephrine titrated to a mean arterial pressure of 65, then 75, then 85 mmHg, in 20 patients with septic shock | Targets reached. Cardiac index, systemic vascular resistance and both stroke work indices rose. Oxygen delivery, consumption and lactate unchanged | Flow index 2.1, 2.2, 2.0 and proportion of perfused capillaries 72, 71, 67 percent, unchanged. Perfused capillary density trended down, 18 to 17 to 14 vessels/mm2, and the change was inversely related to baseline density, R2 = 0.95 |
| Dobutamine 5 mcg/kg/min against placebo, crossover, in 20 patients with septic shock, adequate cardiac index and persistent hyperlactataemia | Cardiac index, heart rate and ejection fraction all rose significantly | Perfused vessel density 9.0 against 9.1 per mm and flow index 2.1 against 2.1. Lactate, carbon dioxide gradient, thenar tissue saturation and capillary refill time unchanged. Indocyanine green clearance and the tissue saturation recovery slope were worse on dobutamine |
| A fluid bolus, 1000 mL Ringer's lactate or 400 mL 4 percent albumin, in 60 patients with severe sepsis | Unrelated to the microcirculatory response, which tracked neither the change in cardiac index (R2 = 0.05) nor the change in mean arterial pressure (R2 = 0.04) | Perfused small vessel proportion rose from 65 to 80 percent within 24 hours of diagnosis, and moved from 75 to 74 percent after 48 hours. Same intervention, opposite result, decided by timing |
The norepinephrine study is often misread. It does not show that norepinephrine harms the microcirculation. It shows that the average response was flat while the individual responses were not, and that the sign of each was set almost entirely by where the patient started: those with a very low baseline perfused capillary density tended to improve as the pressure rose, and those already reasonable tended to worsen. That is an argument against a fixed pressure target, and the physiological reason the trials of a higher target have been so consistently neutral in aggregate. Module I5 takes up what it means for an individual patient.
The dobutamine result, from Hernandez and colleagues, is the cleanest refutation of the reflex that a bed which will not recruit needs more flow through it. Cardiac index, heart rate and ejection fraction all rose, and not one measure of microcirculatory, metabolic, hepatosplanchnic or peripheral perfusion improved. Two deteriorated. The next section explains why that is not surprising.
The endothelial glycocalyx
The luminal surface of every endothelial cell is coated with a gel layer of membrane-bound proteoglycans, glycosaminoglycan chains, glycoproteins and adherent plasma proteins. It is invisible on conventional histology, which is why it was underappreciated for decades, and it is thick enough relative to a capillary lumen to be a significant part of the vessel. Four of its functions matter here, and sepsis attacks all four at once.
- It is the permeability barrier. The competent barrier to protein is the glycocalyx, not the intercellular cleft, which is the point on which the revised Starling principle turns. That physiology, and where an infused bolus ends up, belongs to module I7.
- It is the shear sensor. Flow deforms the glycosaminoglycan chains, and that mechanical signal is transduced into endothelial nitric oxide release. It is how a vessel knows flow has increased, and how an upstream arteriole learns that a downstream bed has opened.
- It keeps the surface non-thrombogenic, holding antithrombin and other regulators at the endothelium.
- It holds leukocytes off, physically screening the adhesion molecules beneath it.
In sepsis, as Uchimido, Schmidt and Shapiro set out, the layer is shed enzymatically. Metalloproteinases, heparanase and hyaluronidase are activated by reactive oxygen species and by proinflammatory cytokines including tumour necrosis factor alpha and interleukin-1 beta. The consequences map one to one onto the four functions: vascular hyperpermeability, unregulated vasodilation, microvessel thrombosis and augmented leukocyte adhesion. Circulating and urinary levels of the shed components correlate with organ dysfunction, severity and mortality across a range of clinical studies, which is the best available evidence that the degradation is not incidental.
The second function closes the loop with the previous section. Capillary recruitment is not a passive hydraulic event. A closed capillary does not open because the pressure upstream rose. It opens because increased flow and shear in the vessels around it are sensed by the endothelium and converted into a vasodilator signal that propagates along the wall to the feeding arteriole: the microcirculation was still reactive. That is why augmenting cardiac output recruits a bed with intact endothelium and does nothing to a bed whose sensor has been stripped off. When the interventional studies report that raising flow sent all of it through the already-open units, this is the mechanism: no recruiting signal is generated, so the extra flow goes exactly where it was already going.
There is an uncomfortable iatrogenic limb. Overaggressive fluid therapy and the hypervolaemia it produces augment glycocalyx degradation, plausibly through atrial natriuretic peptide release, while fresh frozen plasma and albumin may attenuate it. The evidence for the protective side is much weaker than for the harmful side and none of it yet supports choosing a fluid on this basis. What it supports is a habit of mind: a bolus given to fix a microcirculation carries a mechanism by which it damages the barrier that microcirculation depends on.
The waterfall at the arteriolar outlet, and why there is no single systemic resistance
Module I5 derived the critical closing pressure and established that the complete form of the first interface carries it as the downstream term. This section takes the structural consequence, which is larger than the equation looks, and which Magder and, more recently, Pinsky, Monge García and Dubin have argued should change how vasomotor tone is assessed at all.
If a critical closing pressure exists at the arteriolar outlet, then the pressure profile from aorta to right atrium is not continuous. Arterial pressure falls from the mean arterial pressure to Pcc across the arterial resistance, venous pressure falls from the mean systemic filling pressure to the right atrial pressure across the venous resistance, and between Pcc and Pms there is a drop that no resistance accounts for, because it is a waterfall rather than a resistive loss. The system is two circuits in series with a hydraulic break between them.
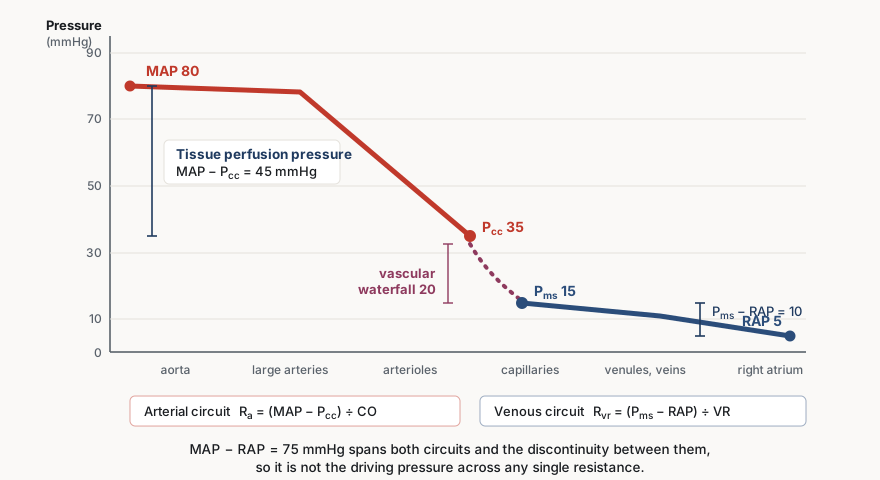
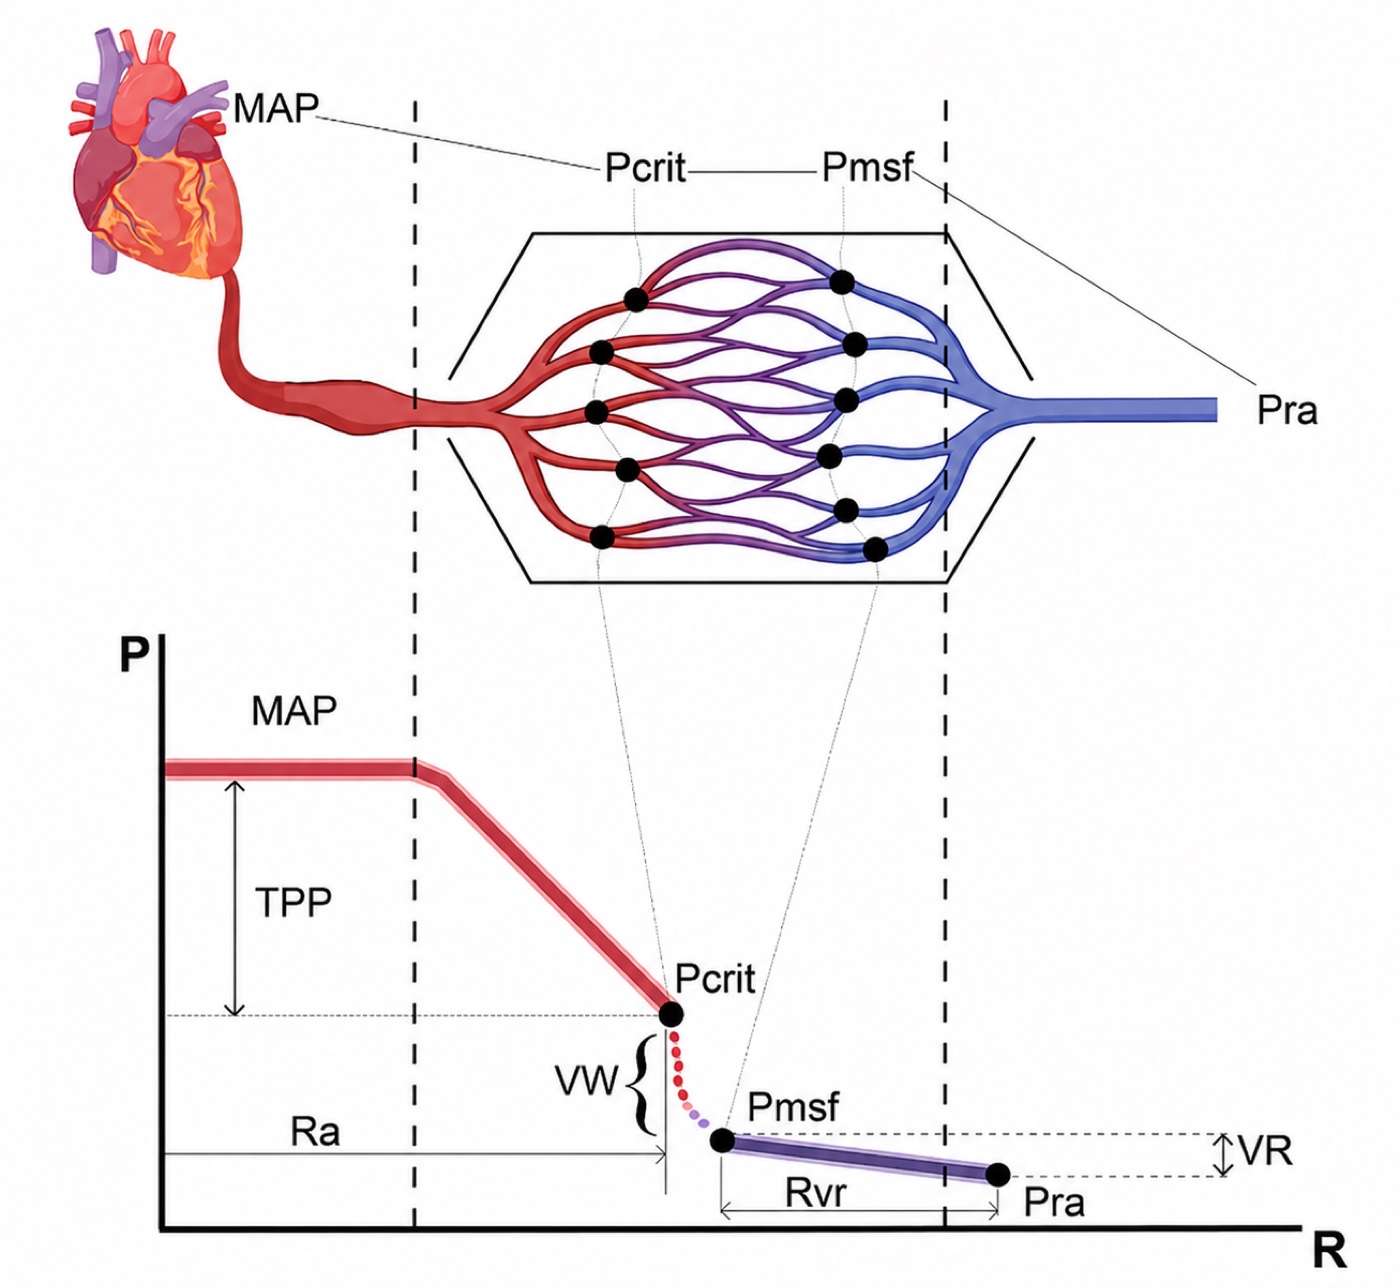
This is not only a diagram. Maas and colleagues measured both endpoints at the bedside in ten ventilated postoperative cardiac surgery patients, building a venous return curve from paired central venous pressure and cardiac output during inspiratory holds to find Pms, and a ventricular output curve from arterial pressure and cardiac output over the same manoeuvres to find Pcc. The filling pressure was 18.7 mmHg and the closing pressure 45.5 mmHg, a difference of 26.8 (S.D. +/- 10.7 mmHg) that persisted after volume expansion. The arithmetic that follows is the part worth carrying. Arterial resistance upstream of Pcc was 8.27 and venous resistance downstream of Pms was 2.75 mmHg·min/L. Their sum, 11.01, differed significantly from the total systemic vascular resistance calculated conventionally, 16.56. The gap between the two is the waterfall, entered into a calculation as though it were a resistance.
Calculated systemic vascular resistance is therefore a lumped parameter for a quantity that does not exist as a single physical resistance, and part of what it reports is the height of a waterfall rather than the calibre of any vessel. It stays useful as a trend, which is how module I4 uses it, but two consequences follow. It can change with no change in vessel calibre at all, if the closing pressure moved. And vasomotor tone raises both MAP and Pcc, because the same smooth muscle sets both, so whether tissue perfusion pressure improves depends on which moves further. If they rise proportionally, the perfusion pressure is unchanged and the monitor is the only thing that improved. If Pcc rises more, the tissue is worse off at a higher blood pressure.
Andrei and colleagues measured this prospectively in 30 patients with vasoplegic hypotension after cardiac surgery who were about to start norepinephrine, determining the mean systemic pressure and the critical closing pressure before and after. Vasoplegia had almost abolished the waterfall, which measured 3.47 mmHg at baseline against the 27 mmHg Maas found in toned postoperative patients. Norepinephrine raised arterial pressure and total peripheral resistance in every patient but restored the waterfall in only 19 of 30, in whom it rose to 43.6 mmHg. Those 19 improved their cardiac index from 1.8 to 2.2 L/min/m2, their capillary refill time from 4.2 to 3.1 seconds and their carbon dioxide gap from 9 to 6 mmHg. The other 11 raised their blood pressure and improved none of those things, and no baseline variable predicted which group a patient fell into. A complementary mechanistic interpretation is that Pcc is local and threshold-dependent: if excessive tone, low inflow pressure or surrounding tissue pressure pushes one vascular territory toward its closing threshold while another remains comfortably patent, heterogeneous flow can appear even when the systemic MAP is unchanged. This pressure-dependent mechanism can coexist with the endothelial, glycocalyx and microthrombotic mechanisms developed below.
 At the bedside. A vasopressor increase that raises the mean arterial pressure and leaves the perfusion markers where they were may have raised the critical closing pressure by as much as it raised the arterial pressure, in which case the tissue perfusion pressure never changed and the next dose will do the same. There is no routine bedside measurement of Pcc, so it has to be inferred from its consequences: judge a pressure intervention by whether the capillary refill time, the carbon dioxide gap and the mottling moved, not by whether the pressure did.
One point generalises this. The critical closing pressure belongs to a vascular bed and not to the body, so it differs between kidney, gut, brain and skin, and it is modified by whatever pressure surrounds the vessels of that bed: alveolar pressure in the lung, intracranial pressure in the brain, interstitial pressure in oedematous tissue. That is why autoregulation is organ-specific and why one systemic pressure target cannot be right for every organ in the same patient. Castro, Kattan, Pinsky and colleagues have extended the same logic to the venous side, which belongs to module I7 and module I8.
Peripheral vascular decoupling in sepsis
Microcirculatory disease also leaves a footprint on the macrocirculatory waveform, and this is the one place in the module where it reaches back up and corrupts a measurement made in a large artery.
Normally pulse pressure amplifies as the wave travels distally, so radial pulse pressure exceeds aortic pulse pressure, and module I4 develops why. In sepsis the relationship inverts and central pulse pressure becomes the larger. The mechanism is a difference in where nitric oxide is made. In central elastic arteries it comes from the endothelium, and endothelial production falls in inflammatory states, so central vessels stiffen. In peripheral muscular arteries such as the radial, cytokine-driven induction of inducible nitric oxide synthase in the vascular smooth muscle itself raises local nitric oxide, so peripheral vessels lose tone, become more compliant and reflect less of the wave. Central stiffening and peripheral softening together invert the amplification.
Hatib, Jansen and Pinsky demonstrated this in anaesthetised pigs with fluid-resuscitated endotoxic shock, measuring aortic, femoral and radial pressures with aortic and radial flows and computing impedance, compliance and resistance at each site. At baseline the pulse pressure amplified normally and the Windkessel parameters derived from aortic and from radial pressure agreed. During stable endotoxaemia the aortic pulse pressure exceeded both the femoral and the radial, and the derived parameters diverged: impedance rose and compliance fell when computed from aortic pressure, while impedance fell and compliance rose when computed from radial pressure. Resistance, a mean-pressure quantity, fell similarly on both. Carrara and colleagues found the same inversion in porcine polymicrobial septic shock, added a shortened arterial time constant, and showed that fluids and noradrenaline did not correct it and that it tracked autonomic dysfunction measured as reduced baroreflex sensitivity and suppressed heart rate variability.
The same decoupling has a bedside consequence for how arterial load is estimated. A single-beat arterial elastance is commonly approximated as Ea ≈ 0.9 × SBP ÷ SV, an approximation validated against invasively measured end-systolic elastance and built on the assumption that systolic pressure is measured centrally. If SBP is instead taken from a radial line, the peripheral amplification this section describes, or its inversion in sepsis, changes what that pressure represents, and the factor that recovers a valid Ea estimate is no longer reliably 0.9. When central pulse pressure exceeds radial pulse pressure, as the mechanism above predicts in sepsis, using the radial systolic pressure as though it were central risks the correction running the wrong way.
Two consequences follow, and they are the reason this belongs in a microcirculation module rather than an arterial one. A radial trace in sepsis is not a scaled aortic trace, so the usual correction, that peripheral systolic pressure overstates central systolic pressure, points the wrong way in these patients. This compounds with damping, which is module I3, and the respiratory variation computed from that line inherits both distortions, which is module I13. And every arterial pressure derived cardiac output algorithm assumes a fixed relationship between pulse pressure, compliance and resistance at the sampling site, so decoupling breaks the assumption in a way the algorithm cannot detect. That is why these devices lose precision and trending accuracy in septic shock and during vasopressor titration, and the device physics belongs to the expert pathway.
What each perfusion marker is really reporting
The bedside use of these markers, their thresholds, their trial evidence and how to combine them are all in module I11. What follows is only the microcirculatory mechanism underneath each one, because the mechanism is what tells you when the marker will lie and in which direction.
Lactate: metabolic stress, not a direct flow meter
Blood lactate concentration remains one of the most frequently used biomarkers in critical care and has been extensively validated as a prognostic marker in shock and critical illness. Although it is traditionally interpreted as a surrogate of impaired tissue oxygen delivery, persistent hyperlactataemia reflects a much more complex interplay among oxygen transport, glycolytic flux, adrenergic stimulation, mitochondrial function, microcirculatory flow and metabolic adaptation.
The traditional rationale for using lactate as a perfusion marker begins with cellular redox balance. During glycolysis, glucose is converted to pyruvate while NAD+ is reduced to NADH. For glycolysis to continue, NADH must be reoxidised to NAD+. Under normal aerobic conditions, pyruvate enters the mitochondria and is oxidised through pyruvate dehydrogenase and the Krebs cycle, while reducing equivalents are transferred to the electron transport chain, where oxygen serves as the final electron acceptor.
When oxygen delivery becomes insufficient, oxidative phosphorylation slows, mitochondrial reoxidation of NADH becomes limited, and cytosolic NADH accumulates. Under these conditions, lactate dehydrogenase reduces pyruvate to lactate while oxidising NADH back to NAD+, allowing glycolysis to continue producing ATP despite impaired mitochondrial oxidation. In this setting, elevated lactate is therefore a biologically plausible marker of tissue hypoxia and of the shift toward oxygen-limited glycolytic ATP production traditionally described as anaerobic metabolism.
This reaction also has an important acid-base consequence. The conversion of pyruvate to lactate consumes H+, so lactate formation itself does not acidify the cytoplasm. On the contrary, by regenerating NAD+ and consuming a proton, the lactate dehydrogenase reaction helps sustain glycolytic ATP production while partially limiting cytosolic acidification. Preserving intracellular pH matters because proton concentration alters the ionisation of amino acid side chains and therefore the electrostatic and hydrogen-bond interactions that stabilise protein conformation. By helping resist cytosolic acidification, the reaction contributes to an environment in which proteins can preserve their physiologic tertiary and, where applicable, quaternary structure and enzymatic function. This is only one component of intracellular pH regulation, alongside cellular buffers, membrane transporters and proton extrusion. The lactate dehydrogenase reaction captures this asymmetry directly: pyruvate is reduced to lactate while NADH is oxidised back to NAD+, regenerating the oxidised cofactor that glycolysis requires and consuming a proton in the process, which is why lactate production supports metabolic continuity rather than causing acidosis.
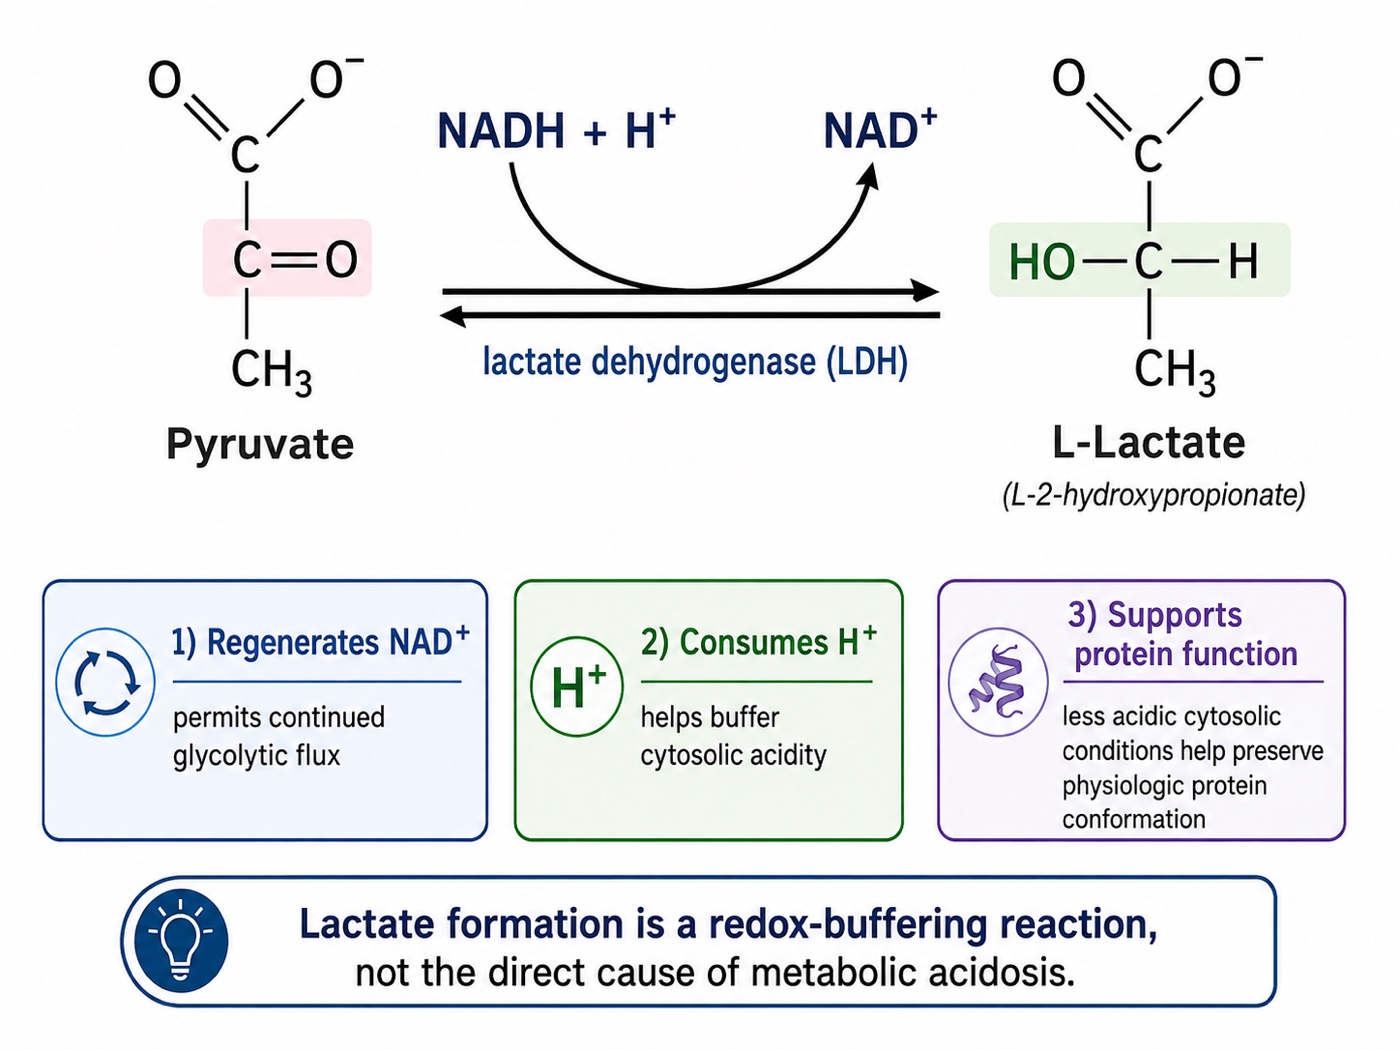
The important caveat is that the same pathway can accelerate even when oxygen is available. In sepsis, shock, exercise, shivering, seizures or epinephrine exposure, β2-adrenergic stimulation increases glycolytic flux and Na+/K+-ATPase activity, generating pyruvate faster than mitochondria can oxidise it. Under those circumstances, a larger fraction of pyruvate is converted to lactate despite preserved oxygen availability. Inflammatory signalling may further impair mitochondrial pyruvate utilisation, including through inhibition of pyruvate dehydrogenase. Hyperlactataemia may therefore reflect increased glycolytic throughput and altered substrate handling rather than tissue hypoxia alone. For this reason, lactate should be interpreted as a marker of metabolic stress, not as a direct flow meter.
A second caveat is that blood lactate is a concentration, not a production meter. What appears in the circulation reflects the balance between production, distribution, utilisation and clearance. Impaired hepatic or renal function may therefore contribute to elevated blood lactate without a major increase in production, whereas preserved uptake and oxidation may blunt the circulating rise despite ongoing regional abnormalities. Thus, an elevated lactate does not necessarily mean that all tissues are globally hypoperfused, and a normal lactate does not exclude regional microcirculatory failure.
That balance is even more dynamic because lactate is not simply a waste product waiting to be cleared. It is a mobile carbon and redox substrate exchanged between tissues and can serve as an important fuel, particularly during stress. Highly oxidative tissues such as the heart, brain and kidneys can take up lactate and oxidise it for energy, while the liver can recycle lactate through gluconeogenesis. Glucose-derived pyruvate may enter the mitochondria for oxidation or be converted to lactate by lactate dehydrogenase, and lactate can then be exported or imported through monocarboxylate transporters and used by other cells as a metabolic substrate, a shuttle that underscores why circulating lactate reflects production, transport, utilisation and clearance rather than the accumulation of a useless end product or anaerobic metabolism alone.
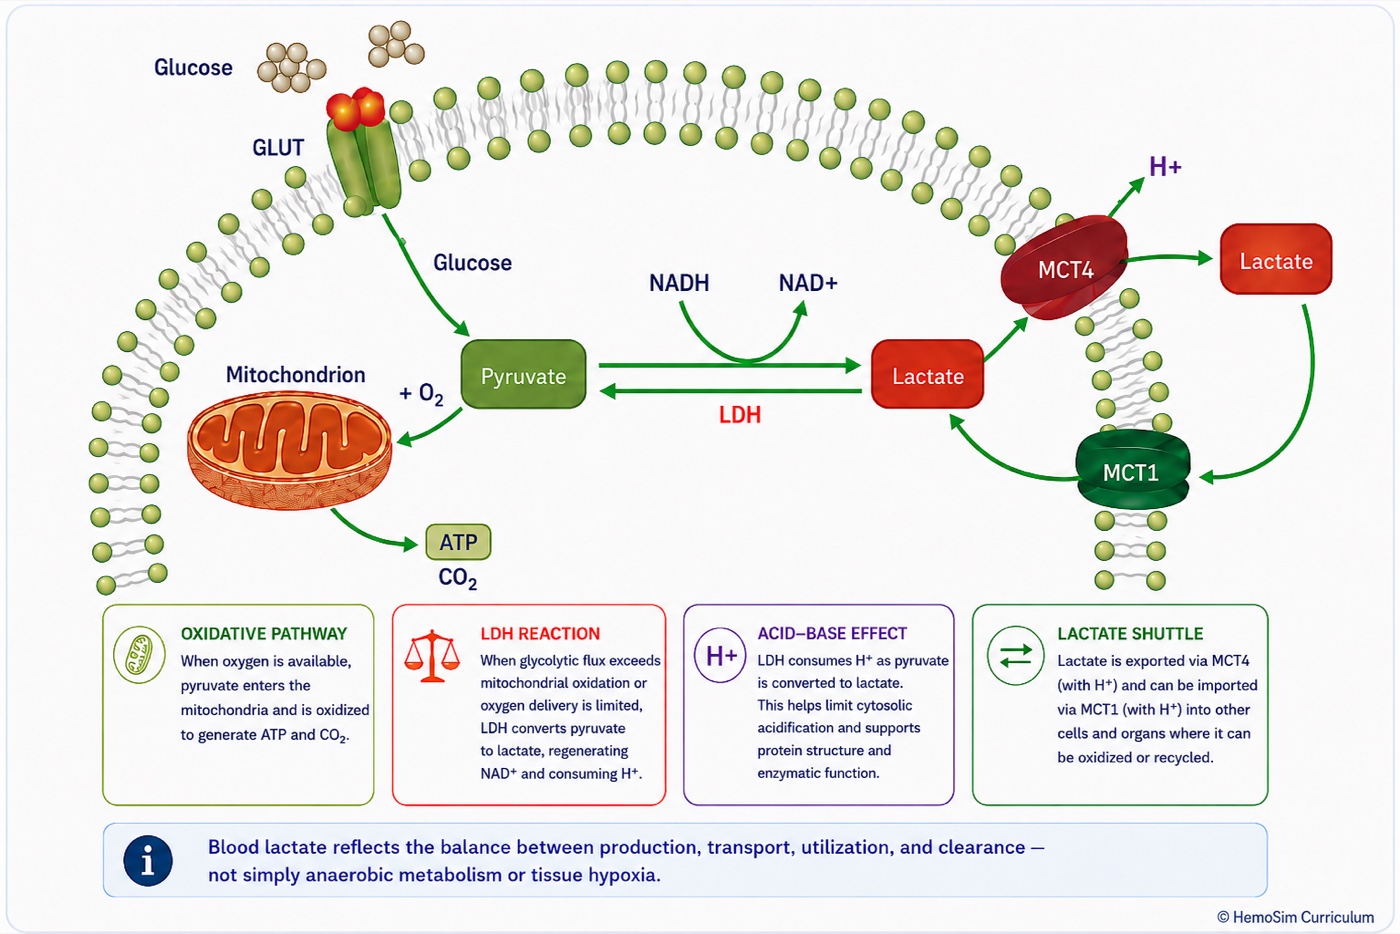
All of this brings us to one of the most persistent misconceptions taught alongside lactate: "lactic acidosis". Hyperlactataemia and metabolic acidosis certainly coexist, sometimes profoundly, but the term becomes physiologically misleading when it implies that lactate itself generates the acidosis. The lactate dehydrogenase reaction consumes rather than generates H+. During metabolic stress, the proton burden arises largely when ATP hydrolysis generates protons faster than oxidative metabolism, intracellular buffering and proton-handling systems can consume, buffer or remove them. Lactate and acidosis therefore commonly rise together because both accompany accelerated glycolytic flux and impaired oxidative metabolism, not because lactate itself is the acidifying agent. In fact, conversion of pyruvate to lactate is part of the compensatory response: it regenerates NAD+, consumes H+ at the lactate dehydrogenase reaction and allows glycolytic ATP production to continue.
Taken together, these mechanisms explain why the bedside interpretation of lactate has to be narrower than the traditional teaching. A rising lactate should always prompt the question of whether oxygen delivery and perfusion are adequate, but it does not prove global tissue hypoxia. Likewise, a normal lactate cannot exclude regional hypoperfusion. Lactate is best interpreted as a marker of whole-body metabolic stress whose mechanism must be inferred from the broader haemodynamic and perfusion context, and its trajectory is generally more informative than a single isolated value.
Central venous saturation and PCO2 gap
The arithmetic at the top of this module is the whole explanation. Central venous saturation is one minus the oxygen extraction ratio, computed as a flow-weighted average across every unit draining into the superior vena cava. A low value is the easy case and means what it appears to mean: extraction has been driven up to defend consumption against inadequate delivery, identifying a flow-limited state that more delivery should help. Everything difficult is on the high side, where at least four distinct physiologies produce the same number.
- Microvascular shunting. The sample is dominated by high-flow low-extraction territory while consumption is low, because the tissue that needs oxygen cannot get any. The figure above.
- Shunting made worse by treatment. Raising cardiac output into a bed that cannot recruit sends the increment through units already open, so the saturation rises further while consumption does not move. A rising central venous saturation after an inotrope is not evidence that the inotrope worked.
- Hyperflux. Delivery genuinely exceeds demand across a homogeneous bed, so each unit extracts a small fraction. This is what recovery on inotropic support looks like, and it argues for weaning rather than escalating.
- Cytopathic hypoxia. Delivery and distribution are adequate and the mitochondrion cannot use the oxygen. A late finding, and it does not respond to haemodynamic treatment at all.
Separating them is not done with the saturation. It is done by watching what the other markers do when the saturation changes, and the key inversion is that a fall in central venous saturation after an intervention can be the success signal. If capillaries have been recruited, more units are participating in exchange, consumption rises, and the venous saturation comes down towards normal because delivery and utilisation have been recoupled. The number moving in the direction that normally worries you is, in that context, the finding most beneficial to your patient.
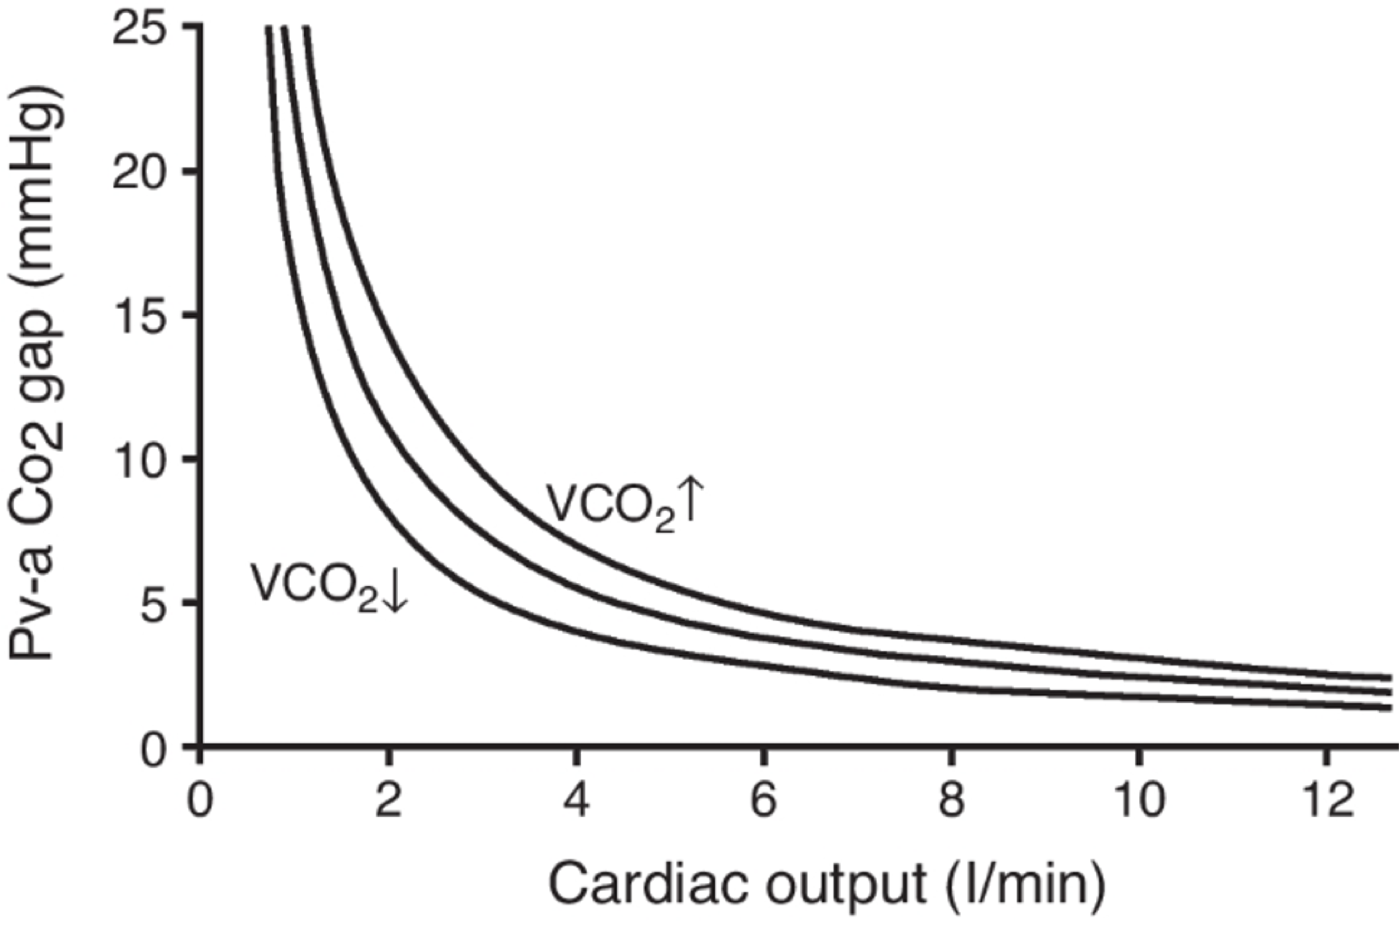
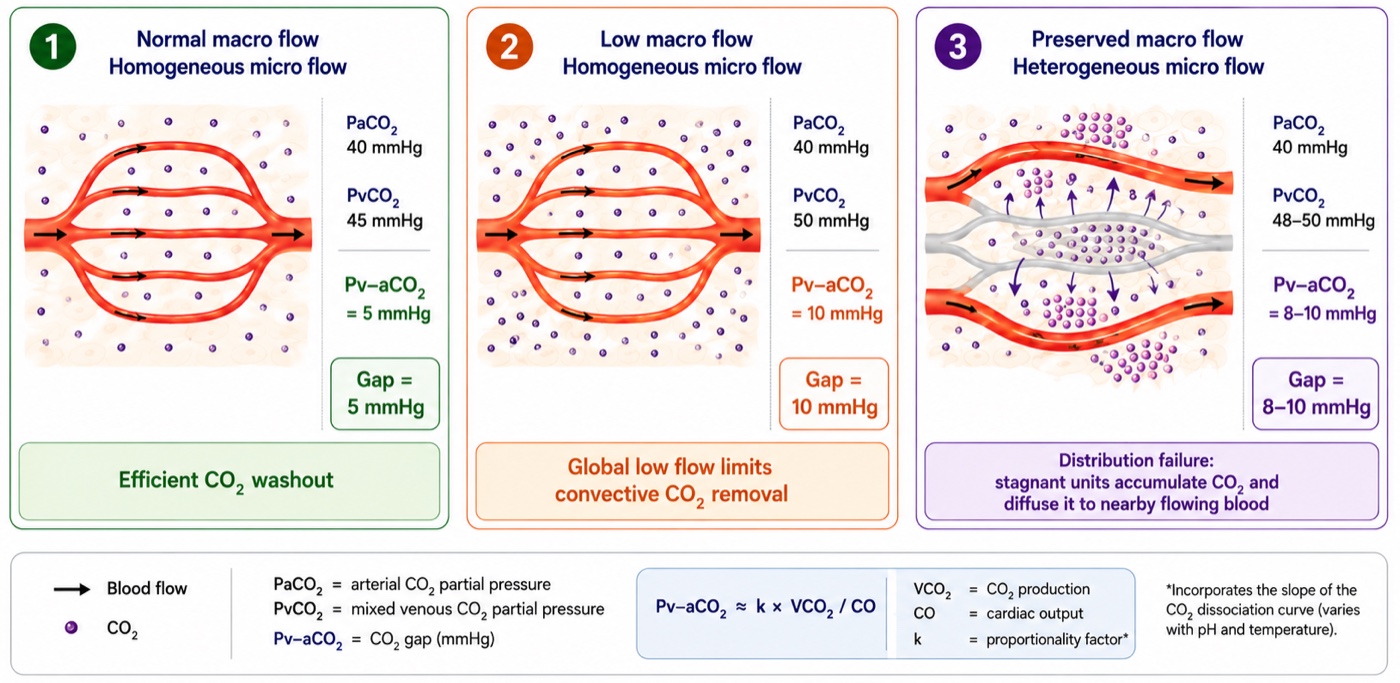
The CO2 gap is a flow marker rather than an oxygenation marker, and the reason is a property of the molecule. Carbon dioxide is produced continuously by every cell and diffuses far more readily through tissue than oxygen does, so it escapes even from poorly perfused tissue into whatever blood is nearby. What limits its removal is not diffusion but convection, the rate at which blood carries it away. Rearranged as a Fick relationship for carbon dioxide:
Two teaching points follow from the form of that expression. The relationship between flow and the gap is inverse and curvilinear, so the gap widens sharply at low cardiac output and changes little across the upper range. And because production sits in the numerator, the whole curve shifts upward as metabolic rate rises: a gap of 6 mmHg in a febrile, agitated, high-output patient is not the same statement as the same gap in a sedated, cooled one.
The gap is useful alongside the saturation because it is sensitive to distribution and not only to total flow. Ospina-Tascón and colleagues studied 75 patients with septic shock by sublingual videomicroscopy and found that the proportion of perfused small vessels fell progressively as the gap widened, independently of global haemodynamic variables. Stagnant capillary units accumulate carbon dioxide locally and it reaches the venous effluent by diffusion into whatever blood passes nearby, so the gap registers a distribution failure that the flow-weighted oxygen saturation cannot. That complementarity is the mechanistic basis of the combined interpretation grid in module I11.
Three caveats limit it. The measurement is a partial pressure while the physiology runs on content, and the two are related by the carbon dioxide dissociation curve rather than by a constant. The Haldane effect means desaturated venous blood binds carbon dioxide more readily, which blunts the measured gap precisely when the central venous saturation is low, while tissue acidosis exaggerates it. And a wide gap does not distinguish whether the problem reflects reduced macrocirculatory flow or microvascular maldistribution in the setting of increased capillary heterogeneity.
Mottling score and CRT: Peripheral perfusion parameters
The mottling score grades the anatomical extent of violaceous reticular discoloration over the anterior knee and leg: 0 for none, 1 for a small area over the patella, 2 to the upper edge of the knee, 3 to mid-thigh, 4 to the upper thigh, and 5 beyond it. The number is not an intensity. It is an area, and the area encodes how far up the limb the skin microcirculation has failed. It is a direct visual measure of spatial heterogeneity, obtained without a device.
The construct has been validated against the microcirculation from two directions. Ait-Oufella and colleagues measured skin perfusion by laser Doppler over the same area they were scoring and found 37 perfusion units at a score of 0 to 1, against 22 at 2 to 3 and 23 at 4 to 5. More convincingly, they tracked change: in every patient whose score worsened, skin perfusion fell to 63 (S.D. +/- 11 percent) of baseline, and in every patient whose score improved it rose to 173 (S.D. +/- 47 percent). Dumas and colleagues showed the score predicts 14 day mortality whatever the vasopressor dose and whatever the other perfusion parameters are doing, which is what you would expect of a variable that reports something the systemic numbers do not carry.
Kazune and colleagues then imaged the knee with hyperspectral imaging in 95 patients with septic shock and defined the ceiling of the instrument, which is the part worth knowing. Microcirculatory oxygen saturation was lower at a score of 2 than at 0, and a score of 2 carried an odds ratio for 28 day mortality of 15.31, but there was substantial overlap between adjacent scores and no significant difference in saturation between any of the scores above 2. The quantitative saturation predicted mortality more specifically than the score did. The mottling score is therefore a genuine measure of microcirculatory failure that saturates: it separates mottled from unmottled and it separates the extremes, and above roughly a score of 2 it stops resolving severity.
Three mechanisms run in parallel underneath the sign. Microcirculatory hypoperfusion, with nutritive flow inadequate for local metabolism. Regional endothelial dysfunction, evidenced by impaired acetylcholine-induced vasodilation, worse in non-survivors, which is the same regulatory failure the sublingual studies show and which plasminogen activator inhibitor 1 levels track. And sympathetic redistribution away from the skin to defend brain and heart, compounded by microvascular thrombosis and surface cooling. Two practical limits follow: mottling cannot be scored reliably in darker skin, and livedo of other causes, peripheral vascular disease and a cold environment all mimic it.
Capillary refill time interrogates the same bed by a different route. Module I11 (opens in a new tab) will frame it as a provoked test of peripheral microvascular reactivity rather than a static description, and that framing is exactly right here. A refill time that remains prolonged despite correction of systemic haemodynamics therefore raises the possibility that the peripheral circulation has not responded appropriately, but it does not identify the mechanism by itself.
Recent human data provide a mechanistic link. Capillary refill time is a refill test: once external pressure is released, blood must re-enter the skin from the arterial side. In 74 post-cardiac surgery patients, Andrei and colleagues found that capillary refill time changes tracked Pcc, but not Pms, suggesting that part of the signal reflects the arterial conditions governing arteriolar patency and refilling. The study did not directly measure microvascular flow, so this remains an indirect link rather than proof of restored macro-to-microcirculatory coupling.
The markers do not all report the same bed
A final caution applies to every marker above. There is no such thing as measuring "the microcirculation". A central venous saturation reports the drainage territory above the diaphragm, the skin markers report a bed sacrificed early and deliberately, and sublingual videomicroscopy reports a third. Boerma and colleagues imaged the sublingual and the intestinal microcirculation in 23 patients with abdominal sepsis and a newly constructed stoma. On day one there was no correlation between the two flow indices, Spearman coefficient 0.12, and none between either and the systemic variables. By day three, as both normalised, the correlation reappeared at 0.74. Regional dispersion of flow is itself part of the disease, but it may also partly reflect adaptive metabolic quiescence: tissue with lower metabolic demand generates less local demand for flow, so a highly heterogeneous microcirculation is not necessarily entirely pathologic. This distinction is hardest to resolve precisely when the circulation is most disturbed and the information is most needed.
What the microcirculation changes
The four interfaces describe how pressure and flow get from the ventricle to the tissue and back. This module is about what happens when the last step stops answering to the first three. The lesion is often not simply a low mean flow but a maldistributed one, so the mean can become the wrong statistic and every global measurement inherits the problem. Functional capillary density is therefore a key variable, determined by local endothelial and metabolic regulation but also dependent on whether the upstream arterioles supplying those capillaries remain patent. The behavior of the pressure-flow relation at the arteriolar outlet means that estimated closing pressure, systemic vascular resistance and actual regional perfusion are not interchangeable quantities, and a vasopressor can improve the macrocirculatory numbers without guaranteeing that capillary perfusion improved. And the markers that detect all of this are instruments with mechanically predictable blind spots, which is why they are read as a set and as trajectories.
The practical conclusion is narrower than it sounds. Macrocirculatory targets are not wrong, they are necessary, and a patient below them is in trouble. They are a floor rather than an endpoint. Once pressure and flow are adequate the remaining question is whether coupling held, and that is answered by whether the perfusion signals moved, over hours, in the same direction as the haemodynamics.
The circulation now continues past the capillary. The capillary outlet is where the third interface begins, with the Starling forces and the revised Starling principle that govern where an infused volume actually goes, and from there the venous reservoir and the return of blood to the right heart.
References
- Ince C. Hemodynamic coherence and the rationale for monitoring the microcirculation. Crit Care. 2015;19(Suppl 3):S8. doi:10.1186/cc14726. Free full text.
- Ince C, Boerma EC, Cecconi M, De Backer D, Shapiro NI, Duranteau J, Pinsky MR, Artigas A, Teboul JL, Reiss IKM, Aldecoa C, Hutchings SD, Donati A, Maggiorini M, Taccone FS, Hernandez G, Payen D, Tibboel D, Martin DS, Zarbock A, Monnet X, Dubin A, Bakker J, Vincent JL, Scheeren TWL. Second consensus on the assessment of sublingual microcirculation in critically ill patients: results from a task force of the European Society of Intensive Care Medicine. Intensive Care Med. 2018;44(3):281-299. doi:10.1007/s00134-018-5070-7.
- De Backer D, Creteur J, Preiser JC, Dubois MJ, Vincent JL. Microvascular blood flow is altered in patients with sepsis. Am J Respir Crit Care Med. 2002;166(1):98-104. doi:10.1164/rccm.200109-016oc.
- Sakr Y, Dubois MJ, De Backer D, Creteur J, Vincent JL. Persistent microcirculatory alterations are associated with organ failure and death in patients with septic shock. Crit Care Med. 2004;32(9):1825-1831. doi:10.1097/01.ccm.0000138558.16257.3f.
- De Backer D, Donadello K, Sakr Y, Ospina-Tascon G, Salgado D, Scolletta S, Vincent JL. Microcirculatory alterations in patients with severe sepsis: impact of time of assessment and relationship with outcome. Crit Care Med. 2013;41(3):791-799. doi:10.1097/CCM.0b013e3182742e8b.
- Trzeciak S, Dellinger RP, Parrillo JE, Guglielmi M, Bajaj J, Abate NL, Arnold RC, Colilla S, Zanotti S, Hollenberg SM. Early microcirculatory perfusion derangements in patients with severe sepsis and septic shock: relationship to hemodynamics, oxygen transport, and survival. Ann Emerg Med. 2007;49(1):88-98. doi:10.1016/j.annemergmed.2006.08.021.
- Edul VSK, Enrico C, Laviolle B, Vazquez AR, Ince C, Dubin A. Quantitative assessment of the microcirculation in healthy volunteers and in patients with septic shock. Crit Care Med. 2012;40(5):1443-1448. doi:10.1097/CCM.0b013e31823dae59.
- Ellis CG, Bateman RM, Sharpe MD, Sibbald WJ, Gill R. Effect of a maldistribution of microvascular blood flow on capillary O2 extraction in sepsis. Am J Physiol Heart Circ Physiol. 2002;282(1):H156-H164. doi:10.1152/ajpheart.2002.282.1.H156.
- Dubin A, Pozo MO, Casabella CA, Pálizas F Jr, Murias G, Moseinco MC, Kanoore Edul VS, Pálizas F, Estenssoro E, Ince C. Increasing arterial blood pressure with norepinephrine does not improve microcirculatory blood flow: a prospective study. Crit Care. 2009;13(3):R92. doi:10.1186/cc7922. Free full text.
- Hernandez G, Bruhn A, Luengo C, Regueira T, Kattan E, Fuentealba A, Florez J, Castro R, Aquevedo A, Pairumani R, McNab P, Ince C. Effects of dobutamine on systemic, regional and microcirculatory perfusion parameters in septic shock: a randomized, placebo-controlled, double-blind, crossover study. Intensive Care Med. 2013;39(8):1435-1443. doi:10.1007/s00134-013-2982-0.
- Ospina-Tascon G, Neves AP, Occhipinti G, Donadello K, Büchele G, Simion D, Chierego ML, Silva TO, Fonseca A, Vincent JL, De Backer D. Effects of fluids on microvascular perfusion in patients with severe sepsis. Intensive Care Med. 2010;36(6):949-955. doi:10.1007/s00134-010-1843-3.
- Uchimido R, Schmidt EP, Shapiro NI. The glycocalyx: a novel diagnostic and therapeutic target in sepsis. Crit Care. 2019;23(1):16. doi:10.1186/s13054-018-2292-6. Free full text.
- Pinsky MR, Monge García MI, Dubin A. Significance of critical closing pressures (Starling resistors) in arterial circulation. Crit Care. 2024;28(1):127. doi:10.1186/s13054-024-04912-4. Free full text.
- Maas JJ, de Wilde RB, Aarts LP, Pinsky MR, Jansen JR. Determination of vascular waterfall phenomenon by bedside measurement of mean systemic filling pressure and critical closing pressure in the intensive care unit. Anesth Analg. 2012;114(4):803-810. doi:10.1213/ANE.0b013e318247fa44. Free full text.
- Magder SA. The highs and lows of blood pressure: toward meaningful clinical targets in patients with shock. Crit Care Med. 2014;42(5):1241-1251. doi:10.1097/CCM.0000000000000324.
- Andrei S, Bar S, Nguyen M, Bouhemad B, Guinot PG. Effect of norepinephrine on the vascular waterfall and tissue perfusion in vasoplegic hypotensive patients: a prospective, observational, applied physiology study in cardiac surgery. Intensive Care Med Exp. 2023;11(1):52. doi:10.1186/s40635-023-00539-x. Free full text.
- Castro R, Kattan E, Retamal J, Hernández G, Pinsky MR. Venous congestion from a vascular waterfall perspective: reframing congestion as a dynamic Starling resistor phenomenon. Intensive Care Med Exp. 2025;13(1):119. doi:10.1186/s40635-025-00828-7. Free full text.
- Hatib F, Jansen JR, Pinsky MR. Peripheral vascular decoupling in porcine endotoxic shock. J Appl Physiol (1985). 2011;111(3):853-860. doi:10.1152/japplphysiol.00066.2011. Free full text.
- Carrara M, Herpain A, Baselli G, Ferrario M. Vascular decoupling in septic shock: the combined role of autonomic nervous system, arterial stiffness, and peripheral vascular tone. Front Physiol. 2020;11:594. doi:10.3389/fphys.2020.00594. Free full text.
- Chen CH, Fetics B, Nevo E, Rochitte CE, Chiou KR, Ding PA, et al. Noninvasive single-beat determination of left ventricular end-systolic elastance in humans. J Am Coll Cardiol. 2001;38(7):2028-2034. doi:10.1016/s0735-1097(01)01651-5.
- Robergs RA, Ghiasvand F, Parker D. Biochemistry of exercise-induced metabolic acidosis. Am J Physiol Regul Integr Comp Physiol. 2004;287(3):R502-16. doi:10.1152/ajpregu.00114.2004.
- Bakker J, Coffernils M, Leon M, Gris P, Vincent JL. Blood lactate levels are superior to oxygen-derived variables in predicting outcome in human septic shock. Chest. 1991;99(4):956-962. doi:10.1378/chest.99.4.956.
- Vincent JL, Bakker J. Blood lactate levels in sepsis: in 8 questions. Curr Opin Crit Care. 2021;27(3):298-302. doi:10.1097/MCC.0000000000000824.
- Garcia-Alvarez M, Marik P, Bellomo R. Sepsis-associated hyperlactatemia. Crit Care. 2014;18(5):503. doi:10.1186/s13054-014-0503-3. Free full text.
- Ospina-Tascón GA, Umaña M, Bermúdez WF, Bautista-Rincón DF, Valencia JD, Madriñán HJ, Hernandez G, Bruhn A, Arango-Dávila C, De Backer D. Can venous-to-arterial carbon dioxide differences reflect microcirculatory alterations in patients with septic shock? Intensive Care Med. 2016;42(2):211-221. doi:10.1007/s00134-015-4133-2. Free full text.
- Ait-Oufella H, Bourcier S, Alves M, Galbois A, Baudel JL, Margetis D, Bige N, Offenstadt G, Maury E, Guidet B. Alteration of skin perfusion in mottling area during septic shock. Ann Intensive Care. 2013;3(1):31. doi:10.1186/2110-5820-3-31. Free full text.
- Kazune S, Caica A, Volceka K, Suba O, Rubins U, Grabovskis A. Relationship of mottling score, skin microcirculatory perfusion indices and biomarkers of endothelial dysfunction in patients with septic shock: an observational study. Crit Care. 2019;23(1):311. doi:10.1186/s13054-019-2589-0. Free full text.
- Dumas G, Lavillegrand JR, Joffre J, Bigé N, de-Moura EB, Baudel JL, Chevret S, Guidet B, Maury E, Amorim F, Ait-Oufella H. Mottling score is a strong predictor of 14-day mortality in septic patients whatever vasopressor doses and other tissue perfusion parameters. Crit Care. 2019;23(1):211. doi:10.1186/s13054-019-2496-4. Free full text.
- Andrei S, Bar S, Nguyen M, Bouhemad B, Longrois D, Guinot PG. Capillary refill time changes are associated with Vascular Waterfall response in post-cardiac surgery patients. Ann Intensive Care. 2026;16:100105. doi:10.1016/j.aicoj.2026.100105. Free full text.
- Boerma EC, van der Voort PH, Spronk PE, Ince C. Relationship between sublingual and intestinal microcirculatory perfusion in patients with abdominal sepsis. Crit Care Med. 2007;35(4):1055-1060. doi:10.1097/01.CCM.0000259527.89927.F9.
- Schumacker PT, Chandel N, Agusti AG. Oxygen conformance of cellular respiration in hepatocytes. Am J Physiol. 1993;265(4 Pt 1):L395-402. doi:10.1152/ajplung.1993.265.4.L395.